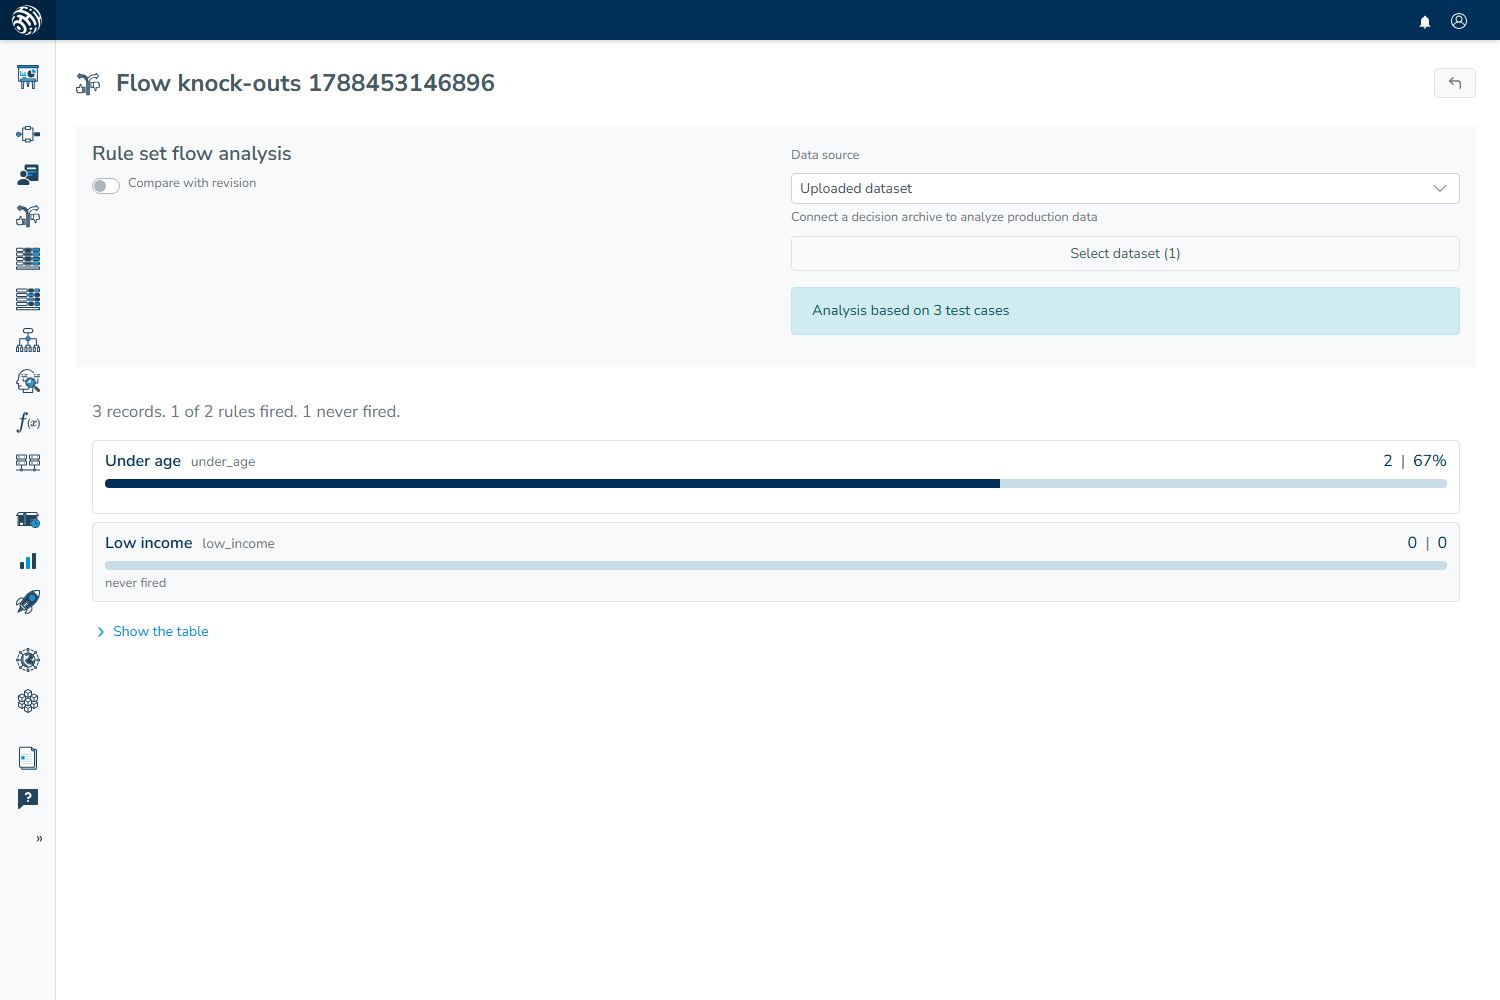
Flow analysis runs a set of cases through a rule set and displays the results on the rules themselves. Each rule shows the number of cases it fired on and its share of the total, while a rule with no matches is marked accordingly. You can also run an earlier revision beside the current one, which makes it easier to see which rules actually affect the cases and how often they do so.
- Opening it
- Choosing the cases
- Reading the rules
- Comparing with an earlier revision
- Where the numbers come from
Opening it
Open a rule set and choose Flow analysis from its settings menu. The analysis page places its controls above the rules, and the back arrow returns you to the rule set editor.
Choosing the cases
Data source contains the same two sources used elsewhere in analysis. In either source, each row has the shape of a request received by a decision flow.
Uploaded dataset runs the analysis over a file held in the browser, with one JSON object on each line. Choose a dataset from the dropdown, or use Manage datasets to add one, then follow the progress bar as the rows are processed.
Decision archive (production data) runs the analysis over real decisions. Set a time window and row limit, then choose Analyze. The run enters the background worker queue in the same way as a backtest, and the page first reports "Waiting for the analysis to start..." before displaying its progress. Earlier runs for this rule set appear below the controls and can be reopened.
If no archive destination is available, this option is greyed out under "Connect a decision archive to analyze production data". See Production data and outcomes.
Reading the rules
A summary sentence above the list gives the main result by stating how many records were analysed, how many rules fired, and how many never fired.
The rules then appear in their own order. Each one has a bar showing its share of the records, alongside the number of cases it fired on and that number expressed as a percentage. Small shares retain their decimals, so a rule that fired five times in ten thousand appears as 0.05% instead of disappearing through rounding. A rule with no hits is shaded and marked "never fired", while inactive rules remain in the list so the analysis reflects the editor.
Show the table opens the same figures in a plain table that you can copy.
A rule that never fires is not necessarily wrong. Its condition may describe cases absent from the sample, or an earlier rule may catch every case that would have reached it because that rule fires first. The Rules on the record table in a release backtest addresses the second possibility, while this page shows whether the rule fired in the selected sample.
Comparing with an earlier revision
Tick Compare with revision and choose a stored revision of the rule set before starting the analysis. The same cases then run through the older revision, and each rule displays both shares together with their difference. The difference is marked up or down when the share has moved by more than a couple of points. A rule missing from the older revision is marked "only in this revision".
This view asks the same question as the Impact analyzer, but shows the answer in the shape of the rule set. It shows what the change did and where that effect appeared in the logic.
Where the numbers come from
The analysis runs the rules on their own, outside the rest of the decision flow, with external data sources switched off. This lets each case reach every rule and keeps the counts focused on the rule set. When one case fires several rules, it is counted once for each of those rules, and each percentage represents a share of all analysed cases rather than a share of another rule's total.
An archive run is stored like any other analysis and appears in Analyses, so you can reopen the results instead of running the analysis again.