Every archive analysis, whether it came from a release, a single artifact or a proposal that checked itself, opens the same result: the answer comes first, the decisions that changed follow it, and the supporting detail remains below.
- The answer
- Decision changes
- Mining the rows behind a cell
- Rules on the record
- Analytics by slice
- Results from an uploaded dataset
- AI Analytics
- Finding a result again
The answer
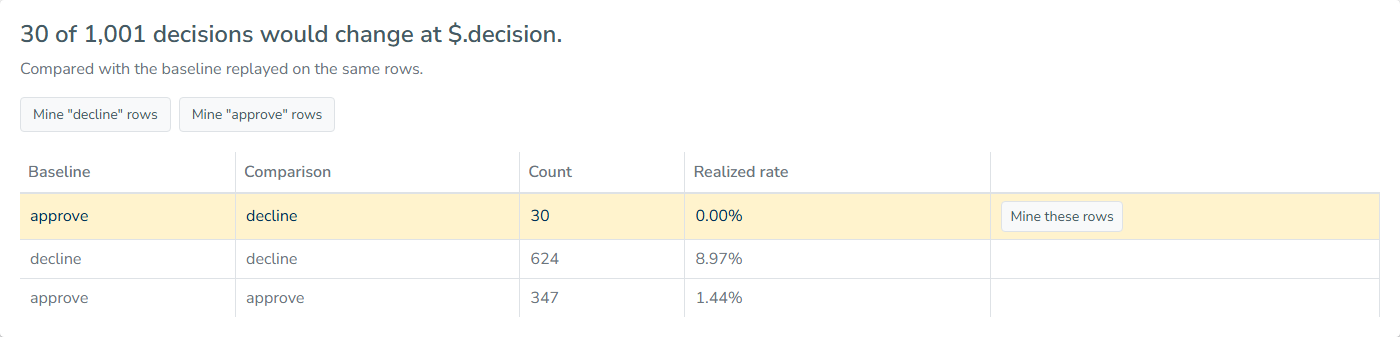
The first line states the complete finding: "30 of 1,001 decisions would change at $.decision", or "No decision would change on these 1,001 rows."
Below it, the result identifies the baseline you chose with one of two sentences: "Compared with the decisions as they were recorded", or "Compared with the baseline replayed on the same rows". If any rows errored, their count appears at the end of that line, and those rows are excluded from everything above it.
The path in the answer is the one the result watches for changes, $.decision by default; this is the value your decision flow writes as its decision, so a change there means the decision would have gone the other way.
Decision changes
The table contains one row for each pair of decisions, showing what the baseline said, what the comparison said and how many rows produced that pair; differing rows are highlighted and sorted to the top, largest first, while unchanged pairs remain below for context, since "30 changed" means something different against 400 approvals than against 40,000.
When a Realized outcome is joined, the table also includes a Realized rate column, showing the bad rate among the rows in that cell; the swap-out cell shows how the applications this change would decline actually performed, while the diagonal shows how the applications it leaves alone performed. If only part of a cell has a label, the labeled count appears in brackets beside the rate.
| Column | What it holds |
|---|---|
| Baseline | The decision as the baseline produced it, or as production recorded it |
| Comparison | The decision the candidate produces |
| Count | Rows in that cell |
| Realized rate | Bad rate among the labeled rows of the cell |
Mining the rows behind a cell
When outcomes are joined, each changed cell includes Mine these rows, and each recorded decision has its own button, such as Mine "approve" rows.
Both options start a rule mining run restricted to exactly those rows, using the same window, endpoint and outcome as the analysis, and open it on the release's Rule mining tab; this turns a result into the next question, whether that concerns the characteristics of applications this change would newly decline or of bad applications it currently approves. See Mining rules from outcomes.
Rules on the record
Rules on the record appears when the analysed release contains rule sets, and it counts how each rule behaved across the rows in the run: how often it Fires, how often it Decides because its result survived to the end, how often it Fires alone, and, when outcomes are joined, the Bad rate when alone.
A rule with something worth noticing carries a note:
| Note | What it is telling you |
|---|---|
| "Inactive." | The rule is switched off |
| "Never fired on these rows." | Nothing in this history matched it |
| "Fires, but a later rule always writes over it." | Its result never survives, so it has no effect |
| "Fires 340 times and decides 12; a later rule writes over the rest." | Mostly overwritten, which is usually an ordering problem |
| "88% of what it catches, Arrears knock-out catches too; removing it changes 41 rows." | Another rule contains it |
| "The 63 rows only this rule rejects had no bad outcome." | Its unique catches were all good applications |
The summary line above the table reports how many rules deserve attention, but it does not change anything itself; it shows where to look in the rule set.
Analytics by slice
If the run carried an Analytics recipe, Analytics by slice contains its measures, computed on both sides and shown in charts. Analysis configuration identifies which recipe ran, lets you substitute another one and recompute it over the same stored result; for a numeric path, the distribution is divided into bands and shown as movement between them, which makes the question behind a scoring change readable: who moved, and how did they perform?
Recipes are described in Analytics Recipes.
Results from an uploaded dataset
A comparison run over a dataset from your browser shows the same measures along with the rows themselves: Table view lists every record with its input, baseline output, comparison output and difference status, and the filter narrows the list to Different or Identical. Download baseline and Download comparison save the two sides for reading elsewhere, while Analytics view switches to the recipe's measures and charts.
AI Analytics
AI Analytics reads the numbers produced by the run and suggests, in plain language, which measures would be worth adding; it sees the aggregates rather than the underlying records and proposes recipe slices without changing anything.
Finding a result again
Analyses in the left menu lists every run with its target, date, starter, rows processed, decisions changed and status; each row reopens the stored result, while the arrow at the end opens the release, entity or case design that the analysis examined.
Results remain with the run, so an analysis from before a change continues to show what it said at that time.