Rule mining identifies the conditions that separate bad cases; policy mining addresses the larger question a credit analyst must answer: given this history, what should the policy be? It follows the standard analysis in order, produces a scorecard and a cutoff, shows the reasoning behind them, and records how the result was reached.
- Starting a pipeline
- What the pipeline does
- The answer
- The cutoff curve
- What moved over time
- The scorecard
- Proposing it
- Changing the working and recomputing
- When a pipeline stops
Starting a pipeline
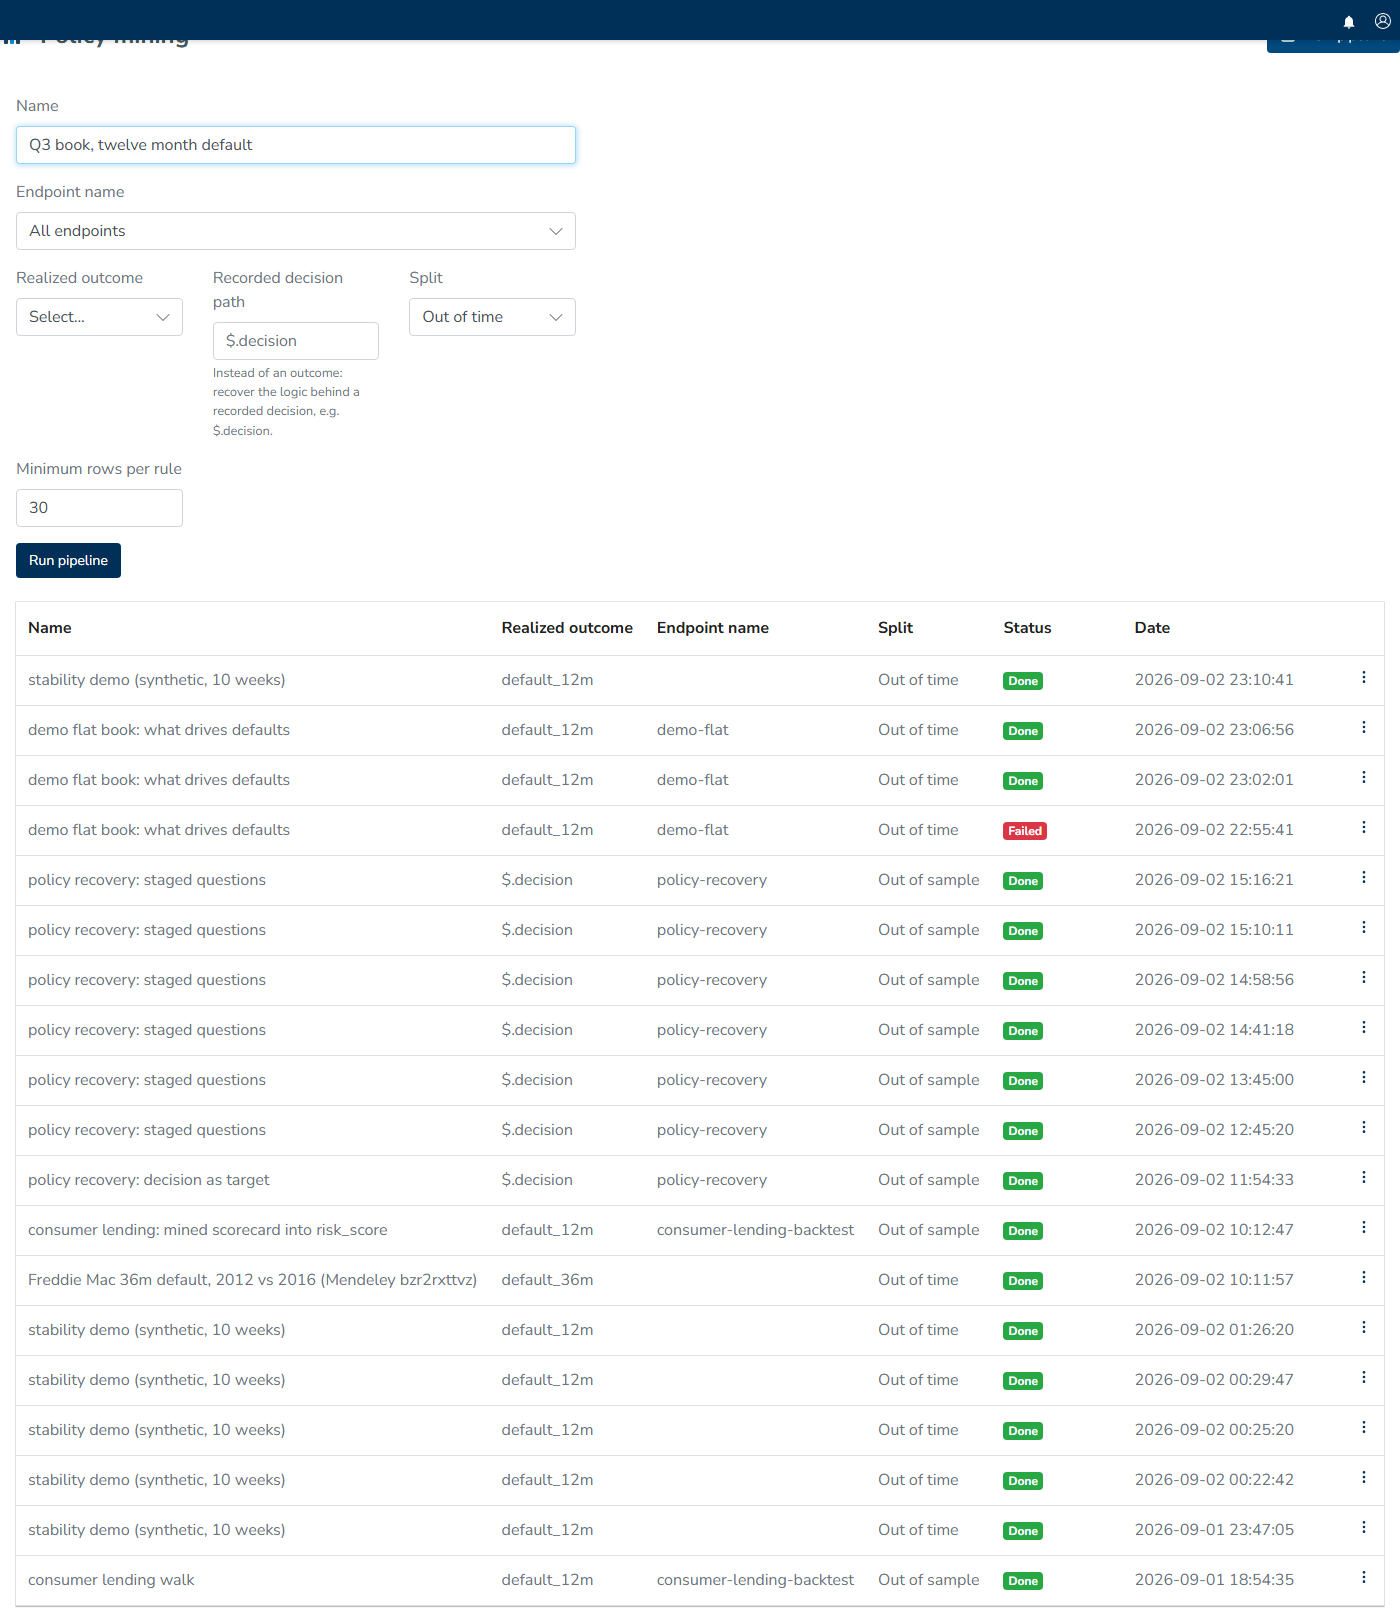
Open Analyses in the left menu, choose Policy mining, and then choose New pipeline.
| Field | What it does |
|---|---|
| Name | What to call this run |
| Endpoint name | Which endpoint's decisions to read, or All endpoints |
| Realized outcome | The label to model. Required unless you are recovering a policy |
| Recorded decision path | The alternative to an outcome: recover the logic behind a decision your flow already recorded, such as $.decision. See Recovering a recorded policy |
| Decision that means declined | With a recorded decision path, the exact value that counts as a decline |
| Split | Out of time measures early rows against later ones, and is the honest test for a policy you intend to run next quarter. Out of sample mixes periods and catches noise but not drift |
| Minimum rows per rule | The support floor for bins and candidates, 30 by default |
Choose Run pipeline to queue the analysis and open its pipeline page. The page reports "Working on it. This page updates itself." together with the step currently in progress, then refreshes itself until the run finishes.
What the pipeline does
Each step produces an artifact for the next one to read, and the complete set is stored so that opening the page a week later shows the run as it happened.
| Step | What it produces |
|---|---|
| Analysis | The profile of the pool: which attributes exist, their roles, what correlates with what, which ones are worth keeping, and the candidate effects |
| Binning | Each kept attribute cut into bins that hold up, with its weight of evidence per bin and its behaviour over time |
| Scorecard | A fit over the binned attributes, expressed as points per bin |
| Cutoff | The sweep: at every score threshold, the approval rate and the bad rate among what it approves, for the book and per segment |
| Recovered policy | Only for a recorded decision path: the knock-outs, eligibility lines and cutoff that reproduce the record |
| Record | The written account of all of it |
The answer
A finished pipeline presents the answer first and leaves the supporting analysis beneath it.
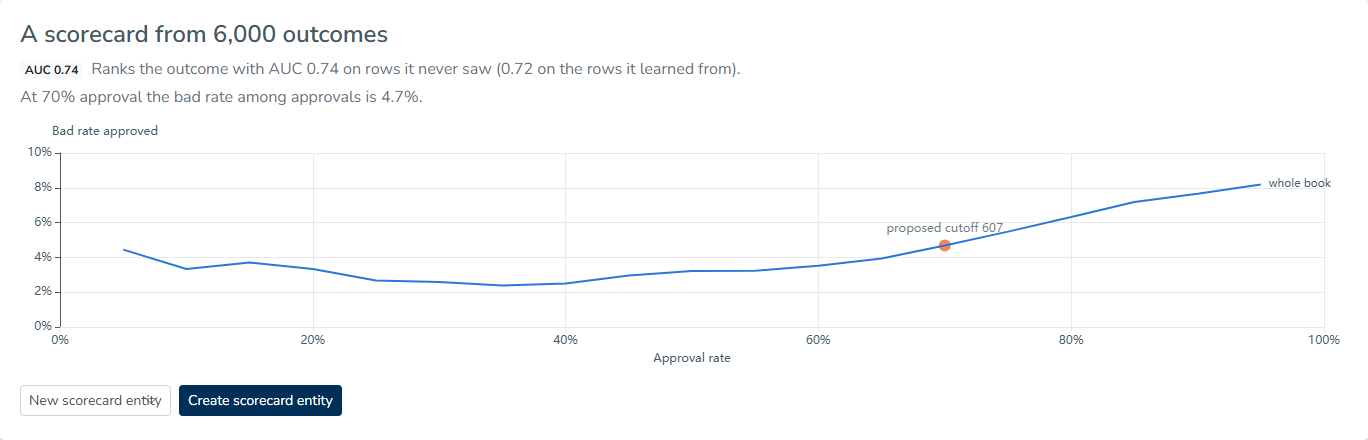
It begins with "A scorecard from 6,000 outcomes", followed by its ranking performance: "Ranks the outcome with AUC 0.74 on rows it never saw (0.72 on the rows it learned from)." The first number is the one that matters; a large gap between the two indicates that the fit learned the training rows rather than the underlying pattern, and the out-of-time split exposes that distinction honestly.
The cutoff is stated next: "At 70% approval the bad rate among approvals is 4.7%." The answer is anchored at seventy percent because that is the figure a head of credit asks for first, and the curve beneath it provides the corresponding reading at any other point.
The cutoff curve
The curve plots approval rate against the bad rate among approvals and marks the proposed cutoff. When product or channel attributes are available, each segment appears beside the whole book line, making it possible to see why a single cutoff should not automatically apply to populations with different results: two segments can have the same approval rate and differ threefold in what they approve.
The Cutoff sheet under the working contains the figures behind the curve, with one row for each threshold and columns for approval rate, bad rate among approved, and bad rate among declined.
What moved over time
What moved over time lists the characteristics whose behaviour did not hold across the periods, as in "3 characteristics did not hold across the periods: months in job, first-time buyer flag, DTI." A characteristic on that list is not necessarily wrong, but it is the first one to examine, because a scorecard built on an attribute that behaves differently each quarter will not perform as measured. How the answer was found explains the verdicts.
The scorecard
The scorecard displays points by band, with one strip for each characteristic and the longest bar representing the greatest number of points. Show table presents the same information as a table of characteristic, band and points, which makes it possible to read the fit line by line and question individual values. That legibility is deliberate: the fit is constrained to something a person can check.
Under the working, Scorecard bins with WOE provides the evidence for each bin, and the fit summary identifies the data used to build it: "Fitted on 5,890 rows. AUC train 0.81, validate 0.77."
Proposing it
A finished scorecard can be added to your decision flow in either of two ways.
Revise Risk score (Score step) takes the scorecard already used by your decision flow and stores the fitted bins and points as a new revision. This is the useful path because a revision can be compared, backtested and released like any other change, and the notice confirms "Proposal saved as a revision. Its backtest is queued."
New scorecard entity creates a separate scorecard for a decision flow that has no scorecard step to revise.
In both cases, links appear to Open the scorecard and to the queued backtest. If you propose the identical scorecard twice, the page answers "This proposal is already the latest revision of that entity". Nothing is deployed until you release it.
Changing the working and recomputing
The binning is open to review. Under Binning and stability, you can drop variables you do not want and press Drop selected and refit, or press Ask AI to review so that the boundaries are examined and a proposal is returned for your approval before you choose Apply and refit. The pipeline is then requeued, reports "Pipeline requeued, recomputing on your version", and rebuilds every downstream step from that version. The record includes your override and identifies it as yours.
See How the answer was found for what is included in those panels.
When a pipeline stops
A failed pipeline reports the reason at the top of the page.
| Message | What it means |
|---|---|
| "Too few rows carry this outcome" | The window matched rows, but not enough of them are labeled to measure anything |
| "Too few rows to validate" | The pool split left one side too thin, usually an out-of-time split on a short window |
| "No variables selected" | Every candidate attribute was suppressed, dropped by correlation, or failed the support floor |
| "The scorecard fit did not converge" | The fit could not settle, normally because a characteristic separates the outcome perfectly |
| "The recorded decision has only one value" | Every row in the window carries the same decision, so there is nothing to recover |
| "The analysis results could not be read" | The stored artifact of an earlier step is unusable. Run the pipeline again |
Widening the window fixes most of these problems, and because a pipeline is inexpensive to run again with every run kept, there is no reason to overwrite one that has already told you something.