Analytics recipes are reusable configurations for analyzing batch test results and comparing decision flow releases. They define what metrics to measure, how to aggregate them, and optionally how to slice the data by dimensions.
What is an Analytics Recipe?
An analytics recipe is a saved configuration that specifies:
- Measures (Slices) - The metrics you want to analyze from your decision output
- Dimensions - Optional grouping criteria for breaking down results
- Aggregations - How to summarize the data (sum, average, count, min, max, quartile, decile)
Once created, you can reuse the same recipe across multiple analyses without reconfiguring the metrics each time.
When to Use Analytics Recipes
Analytics recipes are useful when you:
- Run batch tests regularly - Save time by reusing the same analysis configuration
- Compare release revisions - Understand how changes in decision logic affect outcomes
- Monitor key metrics - Track consistent KPIs across different test runs
- Perform impact analysis - Measure the effect of rule changes on specific dimensions
Creating an Analytics Recipe
From the Recipes Management Page
- Navigate to
/analysis-recipesin your browser - Click "New analysis recipe"
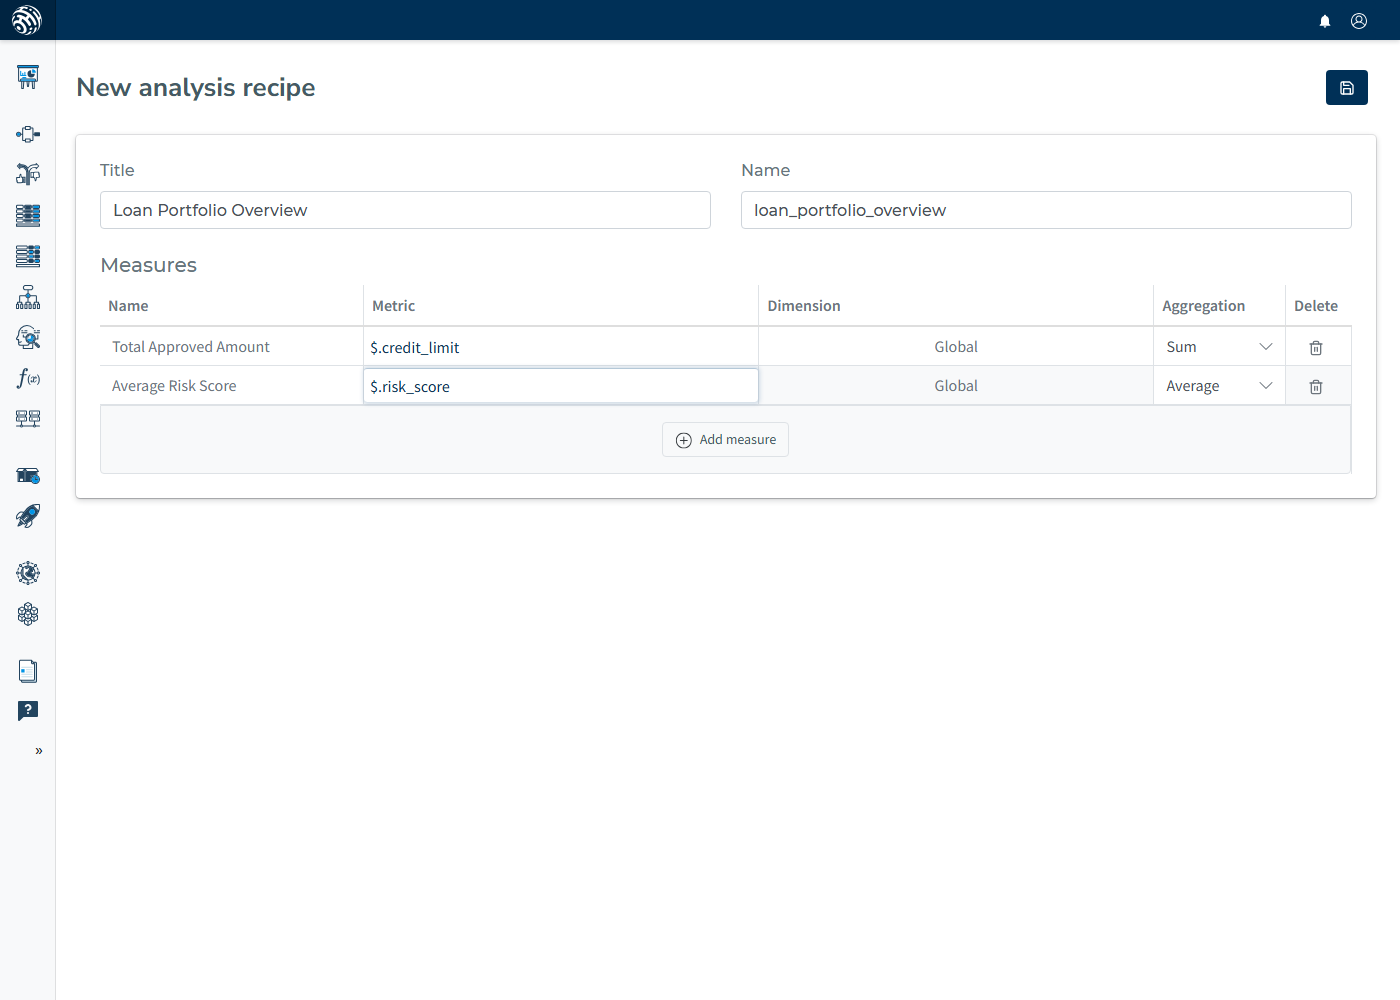
- Fill in the recipe details:
- Title - A descriptive name for the recipe
- Name - A technical identifier (letters, numbers, underscores, hyphens only)
- Add one or more measures (slices)
- Save with Ctrl+S or the save button
Recipe Structure
Each recipe contains one or more slices (measures). Each slice defines:
| Field | Description | Example |
|---|---|---|
| Name | Display label for the metric | "Total Amount" |
| Metric | JSONPath to the value in the output | $.result.amount |
| Dimension | Optional JSONPath for grouping | $.result.category |
| Aggregation | How to summarize values | sum, average, count, etc. |
Aggregation Types
| Aggregation | Description |
|---|---|
| sum | Total of all values |
| average | Mean of all values |
| count | Number of occurrences |
| min | Minimum value |
| max | Maximum value |
| quartile | Distribution split into 4 groups (25th, 50th, 75th percentiles) |
| decile | Distribution split into 10 groups (10th, 20th, ... 90th percentiles) |
Using Analytics Recipes
In Release Analytics
When viewing batch test results for a release:
- Click "Analyse results" to open the analytics modal
- Click "From recipe" to expand the recipe selection
- Select your saved recipe from the dropdown
- The form automatically populates with the recipe's measures
- Click "Analyze" to generate charts
Tip: Click the ⚙️ settings icon next to the recipe dropdown to manage recipes in a new tab.
In Impact Analyzer
When comparing revisions using the Impact Analyzer:
- Open the Impact Analyzer sidebar from any decision component
- Select a decision flow, dataset, and revisions to compare
- Choose an Analytics recipe from the dropdown
- Click "Analyze" to run the comparison
The Impact Analyzer will execute both revisions against the dataset and visualize the differences using your recipe's metrics.
Managing Recipes
Accessing the Management Page
You can access the recipes management page in several ways:
- Direct URL: Navigate to
/analysis-recipes - From Analytics Modal: Click the ⚙️ icon next to the recipe dropdown
- From Impact Analyzer: Click the ⚙️ icon next to the recipe dropdown
Editing a Recipe
- Go to the recipes list at
/analysis-recipes - Click on a recipe title to open the edit form
- Modify the title, name, or measures
- Save with Ctrl+S or the save button
Deleting a Recipe
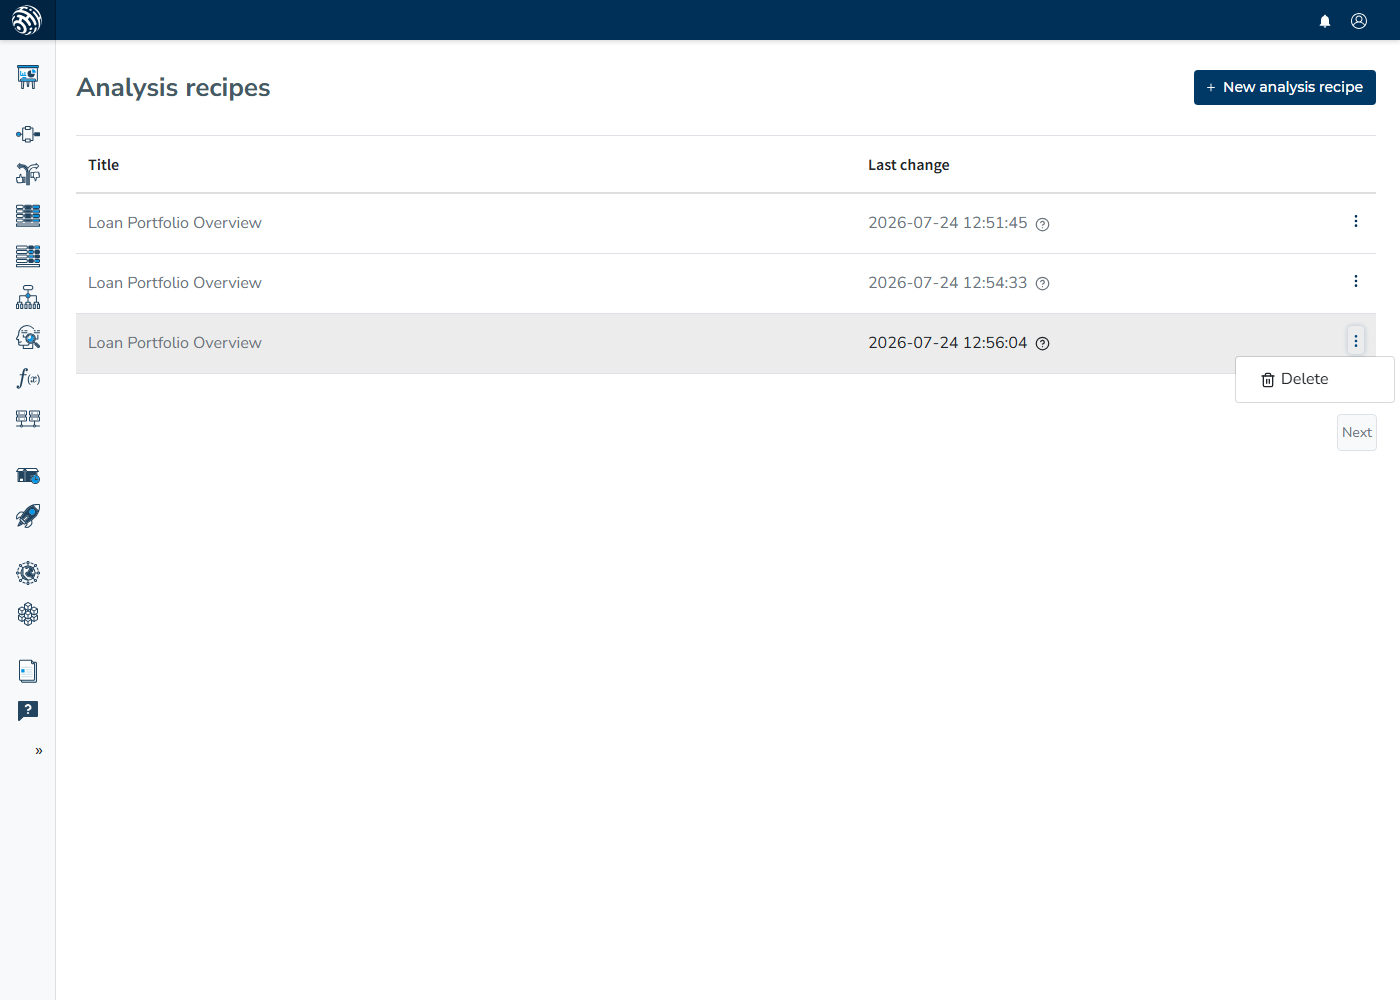
- Go to the recipes list at
/analysis-recipes - Click the three-dot menu (⋮) next to the recipe
- Select "Delete"
- Confirm the deletion
Best Practices
-
Use descriptive names - Make it clear what the recipe analyzes (e.g., "Loan Approval Metrics by Region")
-
Start simple - Begin with 2-3 key metrics, add more as needed
-
Match JSONPaths to your output - Ensure the metric and dimension paths exist in your decision flow output
-
Use dimensions for segmentation - Group by category, region, or status to see patterns
-
Choose appropriate aggregations:
- Use sum for totals (amounts, counts)
- Use average for rates and percentages
- Use decile/quartile for distribution analysis
Example Recipe
Recipe: Loan Decision Analysis
| Name | Metric Path | Dimension | Aggregation |
|---|---|---|---|
| Total Approved Amount | $.result.approved_amount | sum | |
| Approval Rate | $.result.is_approved | average | |
| Amount by Risk Level | $.result.approved_amount | $.result.risk_level | sum |
| Score Distribution | $.result.credit_score | decile |
This recipe would generate:
- A chart showing total approved loan amounts
- The overall approval rate as a percentage
- A breakdown of approved amounts by risk level (Low, Medium, High)
- A distribution chart showing how credit scores are spread across deciles