Flow analysis takes a decision tree and runs a body of cases through it, then draws the resulting counts on the tree itself. Each node shows how many cases reached it and what share of the total that represents, each branch is drawn in proportion to the traffic it carries, and your own measures can be added per node. It answers the question a tree always raises: which paths does the population actually take?
- Opening it
- Choosing the cases
- Reading the tree
- Adding measures per node
- Comparing with an earlier revision
- Where the numbers come from
Opening it
Open a decision tree and choose Flow analysis to open the analysis page, which shows the tree as usual with a controls panel above it; the back arrow returns you to the tree editor.
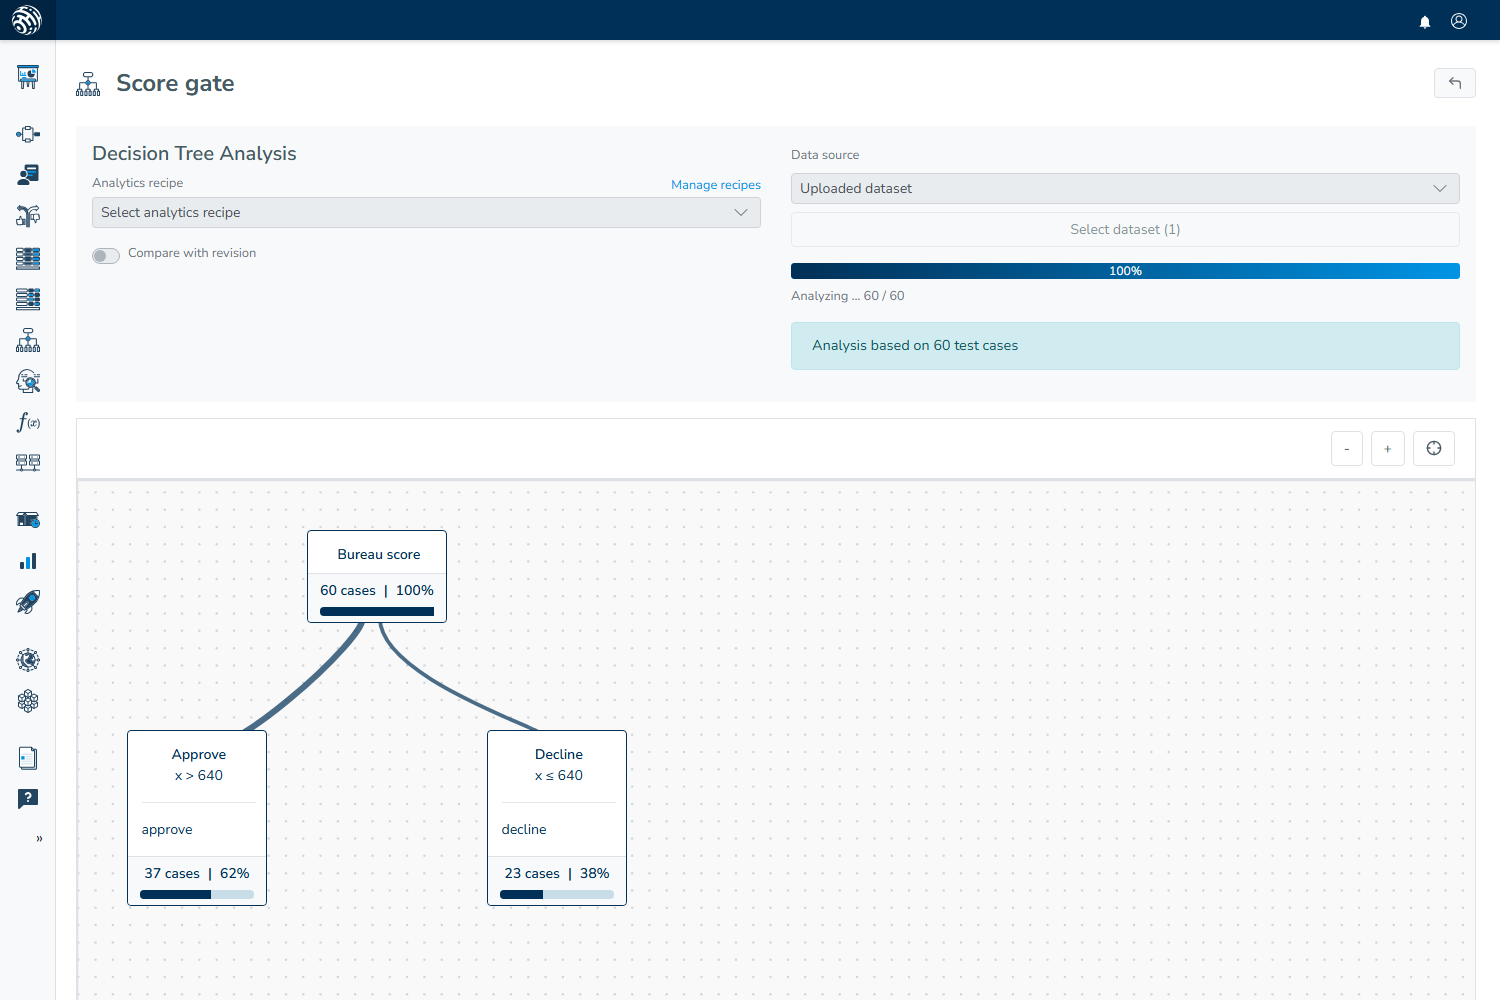
Choosing the cases
Data source offers the same two sources used elsewhere in analysis.
Uploaded dataset runs the analysis over a file kept in the browser: pick a dataset from the dropdown, or use Manage datasets to add one, and watch the progress bar as the rows are processed.
Decision archive (production data) runs the analysis over real decisions instead. Give a window and a row limit, then choose Analyze; the run is queued for the background worker in the same way as a backtest, the page reports "Waiting for the analysis to start..." before showing its progress, and earlier runs for this tree appear underneath so you can reopen one.
Without an archive destination, the second option is greyed out under "Connect a decision archive to analyze production data". See Production data and outcomes.
Reading the tree
Each node carries the number of cases that reached it and that number as a percentage of everything analysed, while links are drawn thicker where more cases flowed through them so that the main path through the tree is visible before you read a single number.
The banner above the diagram states what the picture is based on, such as "Analysis based on 1,240 test cases"; zoom, pan and the centring control work as they do in the tree editor.
Nodes with no traffic deserve attention because a branch that no case reaches may contain a condition that never matches, or one that cannot match, and the tree alone cannot distinguish between those possibilities.
Adding measures per node
Choose an Analytics recipe and each node also shows that recipe's measures, computed over the cases that reached it, such as average exposure at the node or average score in the branch, according to what the recipe defines. Analyse node results opens the slice editor so you can adjust the measures against the run you already have without processing the cases again.
Recipes are shared with the rest of analysis; see Analytics Recipes.
Comparing with an earlier revision
Tick Compare with revision and pick a stored revision of this tree, then choose Run baseline against this revision. The same cases are run through the older revision, after which every node shows both numbers and the difference between them; the difference is marked up or down when the share moved by more than a couple of points, and nodes that exist only in the current revision are marked as new.
This is the tree-shaped view of the same question the Impact analyzer answers for decisions: what did the change do, and where in the logic did it do it?
Where the numbers come from
The cases are run through the tree inside the decision flow it belongs to, in the same way as every other analysis, with external data sources switched off. Counts are per node, so a case that passes through five nodes is counted in all five, while the percentages are shares of the analysed cases rather than shares of one another.
An archive run is stored like any other analysis and appears in Analyses, so the picture can be reopened instead of recomputed.