To create a Decision table, click the "Decision tables" tab, then click the "+ Decision table" button. When you fill in Decision table form, you can save the new Decision table with CTRL+S key shortcut or with the Save button icon.
The best way to think of decision tables is as "flat" versions of decision trees. Another example could be a rule set where all of the rules are based on the same conditions and resultant attributes.
Conditions and Results columns make up a decision table. (actions).
In a decision table, a row's conditions are related in that each one is a requirement. A row's result is defined in accordance with whether all of its conditions are satisfied.
A decision table has a title and an ID, similar to a rule set. The title makes it simple to find the objects. IDs are utilized when decision logic is applied.
Table definition
Give each column in a decision table a title, and then enter the data attribute path in the space provided. When editing a decision table, the name makes it easier to locate the information for a given column. When the decision table is being executed, the attribute path is utilized.
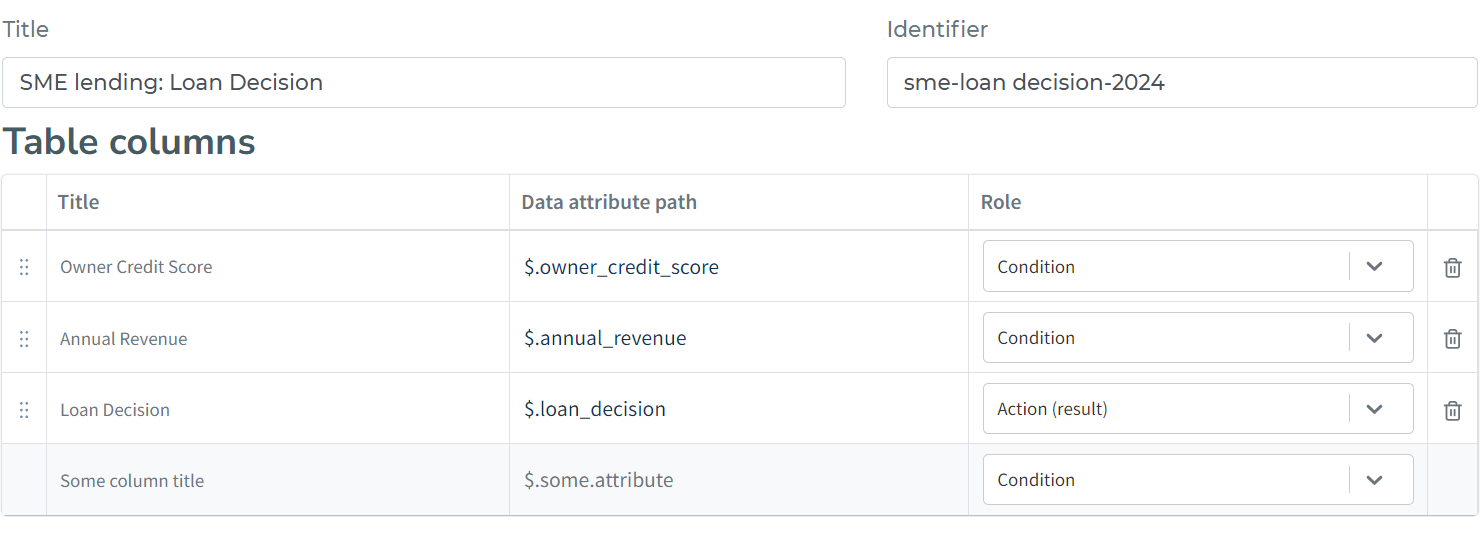
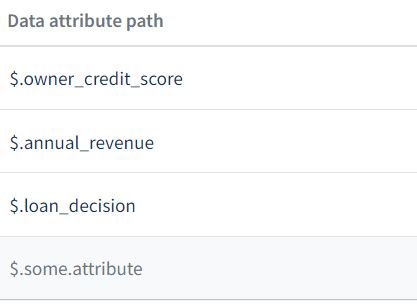
An attribute defines JSONPath to the field of your data object you need to use for evaluation of that column. The field from the data object based on the path will be used for evaluating conditions. In the case of the result, the field defined by JSONPath will be set to the value in the column. Each result cell can also be configured individually to use a dynamic attribute path instead of a static value — see Dynamic Result Values below.
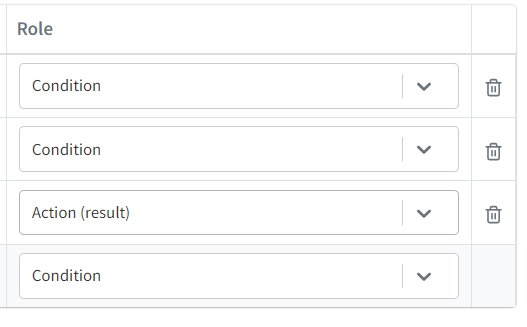
You can use multiple columns for both action and conditions. (result). Next to the data attribute path under the role heading, you can select the column type. There is a cross sign next to the condition or action dropdown box, which can be used to delete a column.
Dynamic Result Values
In result columns, each individual cell can hold either a static value or a dynamic attribute path (JSONPath). This is controlled by a toggle button on the left side of each result cell.
- Value mode (default,
Abcicon): You type a literal value directly into the cell. The engine will always use this exact value as the result for that cell. For example, entering"Approved"means the cell always outputs"Approved". - Attribute mode (attribute icon): You select a JSONPath from your data object. At runtime, the engine reads the value from that path in the input data and uses it as the result dynamically. For example, selecting
$.input.credit_scoremeans the engine passes through the credit score from the incoming data.
To switch between modes, click the toggle button at the left of the result cell. One click switches the mode.
When in attribute mode, the cell provides an autocomplete search that suggests available attribute paths from your data model, making it easy to find the right field without manual typing.

Use Cases
| Scenario | Mode | Cell Value | Result |
|---|---|---|---|
| Fixed decision outcome | Value | "Approved" | Always outputs "Approved" |
| Dynamic score pass-through | Attribute | $.input.credit_score | Passes through the input's credit score |
| Customer segment mapping | Attribute | $.customer.tier | Outputs the customer's tier from input data |
| Static interest rate | Value | 5.5 | Always outputs 5.5 |
When using decision tables, you can change the type of evaluation by opening the operator menu for a condition cell. Decision tables support:
- Standard operators: greater than, equal to, not equal to, etc.
- Interval operators: closed interval, open interval, and range-based conditions
- Text matching: contains, starts with, case-sensitive and insensitive options
- Special operators: any value, null checks, and more

📋 Complete Operator Reference: For detailed descriptions of all available operators, examples, and special handling, see Evaluation Logic Reference.
🎯 Understanding Conditions: Decision tables use the same evaluation logic as other Decisimo components. Each column represents one condition, and all conditions in a row must be true for that row to match. Learn more about Evaluation Logic Reference.
Editing a table
To open the operator menu for a condition cell, click the operator symbol at the left of the cell, right-click anywhere in the cell, or press Alt+Down while the cell is focused. The menu lists every operator with its notation and name. For example, an operator may appear as ≥ x or [a, b).
An interval cell has an opening bracket at the left, two value fields, and a closing bracket at the right. The brackets show which ends are open.
A cell with no condition shows "any". Type in the cell to turn it into an equal-to condition with the value you entered.
Click a row number or right-click it to open a menu with Insert row above, Insert row below, Duplicate, and Delete row. Deleting a row asks for confirmation. Drag a row by the handle to the left of its number to move it. Add row is at the bottom of the table, next to the row count.
Press Enter to move to the cell below, or Shift+Enter to move to the cell above. The arrow keys move between cells when the cursor is at the edge of the text. Press F2 to put the cursor at the end of the cell's text. Press Escape to restore the value the cell had when you entered it.
Tables longer than 200 rows draw only the rows on screen while you scroll. The browser's find (Ctrl+F) does not see rows that are scrolled out of view.
How a table is evaluated
By default every row is evaluated, from the top down, and the table does not stop at the first row that matches. A table can instead be set to stop at the first matching row, see Choosing which matching row wins.
Rows run in the order shown in the editor, which is their row order, not the order they happen to be stored in. A row matches when every one of its condition columns is true. A row with no condition columns at all matches every time, which is how a default row is written.
When two rows both match, the later row's results overwrite the earlier row's. This is what makes the common pattern work: put the broad approval near the top and the knock-out rules below it.
| Row | Condition | Result: $.decision |
|---|---|---|
| 1 | $.amount greater than 0 | approve |
| 2 | $.amount greater than 10000 | refer |
An application for 5,000 matches row 1 only, and the decision is approve. An application for 25,000 matches both rows, and the decision is refer, because row 2 runs last. Reverse the two rows and every application above 10,000 comes out as approve.
A result written by one row can be read by a condition in a later row, so a row can classify an applicant and a row below it can act on that classification.
Choosing which matching row wins
The definition page of a table has a Matching rows setting with two choices.
| Setting | What happens when more than one row matches |
|---|---|
| Last matching row wins | Every row is evaluated and every matching row writes its results, so the row lowest in the table has the final say. This is the default, and the way every table ran before the setting existed. Write the broad rule first and the exceptions below it. |
| First matching row wins | Evaluation stops at the first matching row, and the rows below it are not evaluated. Write the most specific rows first and the catch-all row last. |
With First matching row wins, the example above gives approve for an application above 10,000, because row 1 matches first and row 2 is never reached. Swap the rows and that application comes out as refer.
Pick First matching row wins for a table transcribed from a document that reads as an ordered list, such as "if the score is below 500, decline; otherwise if it is below 650, refer; otherwise approve". Under the default setting such a table quietly returns the last matching label instead of the first, and only on the applications that match more than one row.
The setting is stored with the table, is part of every revision and release, and appears in the release document and in the generated code. The test window, the flow's testing studio and a deployed release all read the same setting.
Values the table does not find
| Situation | What happens |
|---|---|
| The attribute a condition reads is missing from the data | It is treated as 0 in numeric comparisons, so $.income between 0 and 1000 matches an application carrying no income field. Use is null or is not a number when you want to catch missing data on purpose. |
| A dynamic result value points at a path that is missing | The target attribute is set to null, replacing whatever it held. |
| A column uses an operator this engine does not carry, after an import or an older export | The row can never match, and no result on it is ever written. |
Export and Import
It can be difficult to edit decision tables that are more intricate. To expedite editing, use the platform's CSV export feature, edit in a program like Excel, and then import back as CSV.
Go to the “Settings” button in the top right corner, select Settings from the drop-down menu, and then click export to export the decision table.
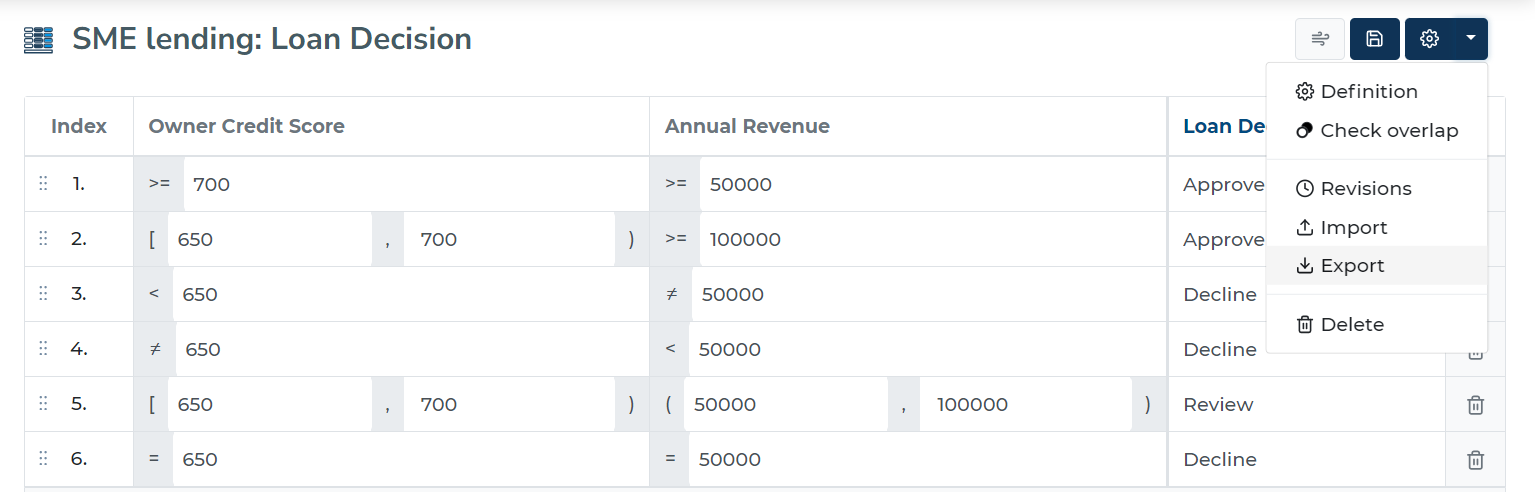
For importing, select your updated CSV file and click import.
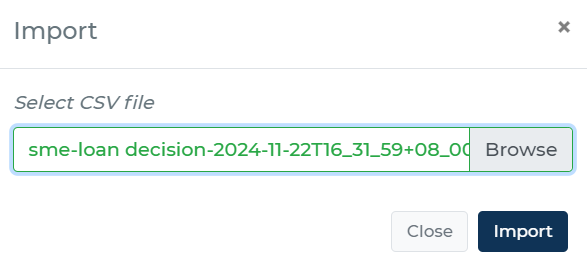
The number of columns in the CSV file must match the number of columns and headings in the decision table. The first row of the CSV will contain the names of columns as the setup of your decision table.
Paste from Excel
For quick edits you do not need the export/import round trip at all — a block of cells can be pasted straight from Excel or Google Sheets into the table.
Copy the cells in your spreadsheet, click the cell in the decision table where the block should start, and press Ctrl+V (Cmd+V on Mac). The block fills the table from that cell down and to the right, and new rows are added automatically when the block is longer than the table. Pressing Ctrl+V without clicking into a cell first pastes from the first cell of the table.
Nothing is stored until you save: review the pasted rows, then save the decision table with the Save button or Ctrl+S.
How pasted cells are read
Condition cells use the same notation as the CSV import, so the operator is set for you:
| Pasted text | Condition |
|---|---|
700 | equal to 700 |
>=700, > 700, <=500, <500 | comparison operators |
<>CZ, !=CZ | not equal to CZ |
[100,200], [100,200), (100,200), (100,200] | interval — the brackets decide which ends are open |
^CZ | starts with CZ |
ing$ | ends with ing |
ANY, *, empty cell | any value |
NULL, IS NULL | is NULL |
The symbols shown in the editor (≥, ≤, ≠, ≈) are accepted as well, so a table copied out of the grid can be pasted back into it. A number written with a thousands separator (1,234.50) is read as 1234.50.
Result cells are taken as literal values. A value starting with $. (for example $.customer.tier) switches the cell to attribute mode — see Dynamic Result Values above.
Column headings
When the first pasted line contains the titles of your columns, it is used to map the columns and is not inserted as data — the columns in your spreadsheet then do not have to be in the same order as in the decision table, and columns you leave out keep their current values. Any other first line is treated as data and pasted by position, starting at the selected cell.
Testing Decision Tables
Decision tables support multiple testing approaches:
- Unit Testing: Test with specific values for each column
- Object Testing: Test with complete data objects
- Simulation Testing: Identify gaps and overlaps in your decision logic
📋 Learn More: For comprehensive testing guidance, see Testing Decision Logic and Testing Decision Tables.
Revisions
Revision history can tell you what a decision table looked in the historical version. You can view what was the definition, and who made the changes.
You can see the revision history of a decision table by clicking “Revisions” from the drop-down menu of “Settings” button icon when viewing a decision table.
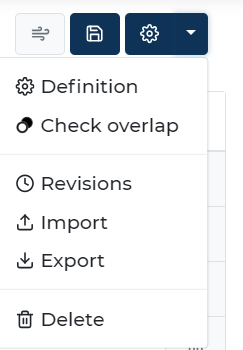
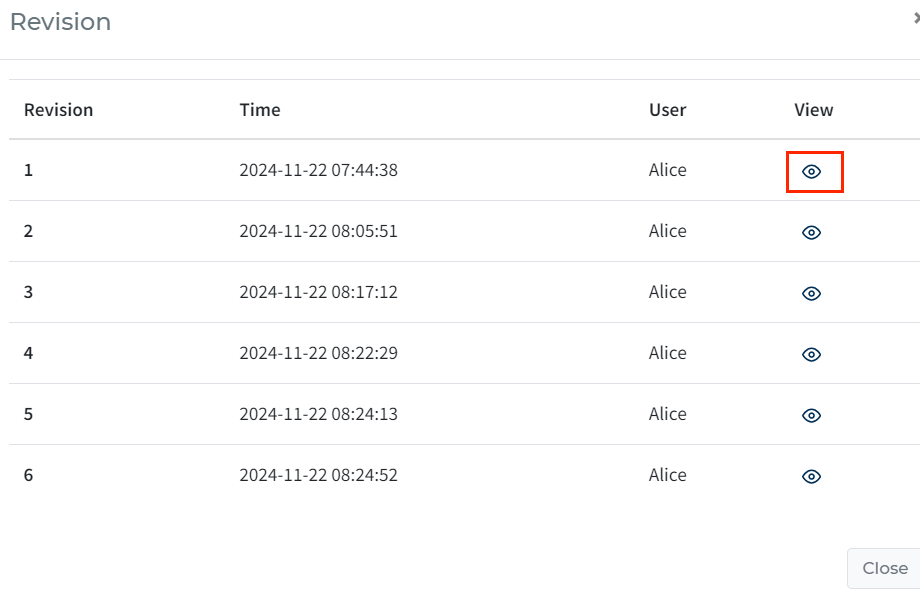
A new modal window will appear after you clicked “Revisions”, with a list of all historical changes and who made them. By clicking the eye icon, you can see the definition of the decision table at that time.