What is a DataFlow Rule?
A DataFlow Rule is a powerful way to analyze groups of transactions together, instead of just looking at them one by one. It helps you apply advanced calculations — like grouping, summarizing, or rolling averages — all inside the rules engine, without needing to code or build reports separately.
Think of a DataFlow Rule as a "mini data processor" inside your decision engine. It can:
- group transactions by a shared feature (like the same month)
- calculate things like totals or counts
- look across a timeline to spot patterns
- transform or rename data fields for easier decisions
- automatically handle currency parsing and conversion in calculations
DataFlow Rules expand what normal rules can do. They make it easier to get an overview of transactions, detect suspicious patterns, or build summaries directly in the rules system.
Why Use a DataFlow Rule?
In most cases, a normal rule checks a simple condition — for example, “Is this transaction amount higher than $1,000?”
But sometimes you need a bigger picture, like:
- How many transactions did the customer make this month?
- What was their average balance over the past three months?
- Are there pairs of transactions that look suspicious together?
A DataFlow Rule is designed for these kinds of tasks. You can:
- group related transactions
- sort them in time order
- calculate sums, counts, or averages with automatic currency parsing
- transform fields (for example, categorize a transaction by its description)
- apply patterns across time (like rolling balances or moving averages)
It’s a way to bring “data analysis” directly into your rules, so you can make better, faster decisions without switching to another reporting system.
Differences to Normal and Iterative Rules
Here's how DataFlow Rules compare:
| Feature | Normal Rule | Iterative Rule | DataFlow Rule |
|---|---|---|---|
| Scope | One data point | Each item in a list | Multiple items together |
| Memory | No memory | No memory, checks each item one by one | Looks across many items in a group |
| Logic | Simple yes/no | Repeat the same check on each item | Advanced group-level summaries, rolling patterns |
| Use Case | "Is this transaction OK?" | "Is each transaction OK?" | "What do these transactions show together?" |
| Complexity | Simple | Slightly more advanced | Designed for complex analysis |
| Currency Handling | Basic parsing per item | Basic parsing per item | Advanced currency aggregation across groups |
In other words:
- Normal rules → simple checks
- Iterative rules → check all items in a list, one by one
- DataFlow rules → analyze the whole group and summarize patterns
Defining a data flow rule
Input Context
This section helps you define what data the DataFlow rule will look at and how to group or sort that data before applying more advanced logic. This is where you tell the rule “here is my list of transactions” and optionally define how to bundle or order them.
DataFlow rules work best if you clearly define three inputs:
| Field | Meaning | Example | Required? |
|---|---|---|---|
| Attribute path | The JSONPath to the list of items you want the rule to process. Think of it as "where are my transactions stored?". | $.transactions | Required |
| Group by path | The JSONPath that tells the rule how to group these items together. | $.month | Optional |
| Order by path | The JSONPath for sorting the data before calculations, usually by a date. | $.date | Optional but recommended |
Currency Handling Note: All monetary calculations in DataFlow rules automatically parse currency symbols and formats. See the Currency Handling Guide for complete details on supported formats.
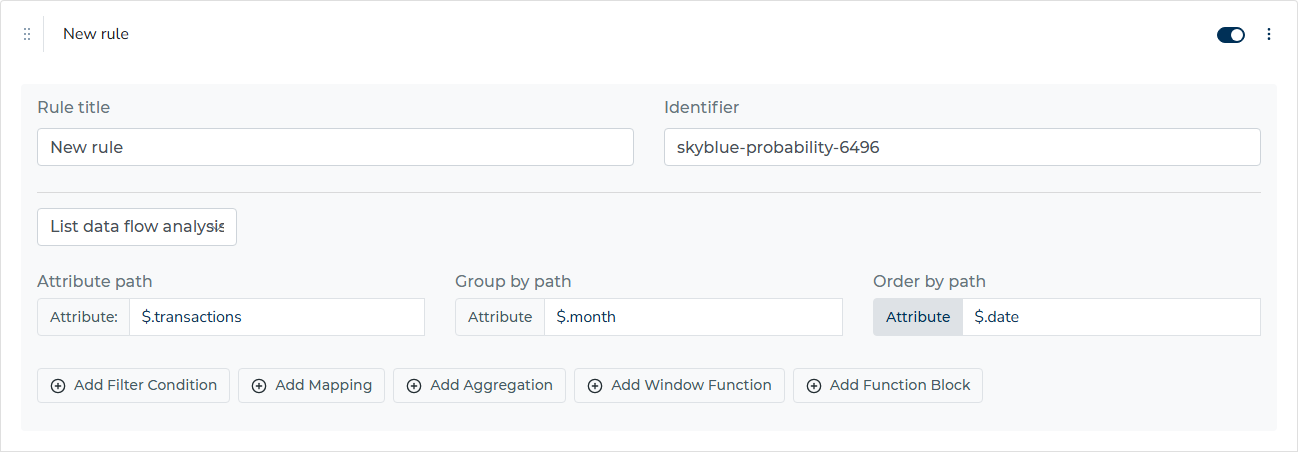
Attribute path
Definition:
This is the main list the rule will look at. It points to where the transactions or data items live in your JSON data. Without this, the rule has nowhere to start.
How it works:
- When you write an Attribute path like
$.transactions, you are telling the rule to "look at every transaction in this array." - From there, the rule will apply its conditions, mappings, groupings, or calculations to each transaction.
- Currency values in the transactions are automatically parsed during calculations.
Group by path
Definition:
Groups the data by a field you define. For example, you might want to see results per month or per user.
How it works:
- If you provide a Group by path, the rule will bundle transactions with the same value in this field together.
- Aggregations and summaries will then run per group.
- If you do not define a group, the rule works on the full list of items as a single group.
Examples:
| Group by path | Meaning |
|---|---|
| $.date[:7] | Group transactions by month |
| $.user_id | Group by customer |
Order by path
Definition:
The rule uses this to sort your data before it applies calculations, which is especially useful for time-based patterns (like running balances).
How it works:
- If you define an Order by path, transactions will be sorted by that field within each group before aggregations or window functions are calculated.
- If you do not provide it, the rule may use the order in which data arrives, which is less predictable.
Examples:
| Order by path | Meaning |
|---|---|
| $.date | Sort transactions by their date |
| $.amount | Sort by transaction amount (less common) |
Order of Execution in this block
For the Input Context, the engine follows this sequence:
- Load the list using the Attribute path
- Apply Group by path to split items into buckets
- Sort each bucket by Order by path
- Pass each group to the next stages (filtering, mapping, aggregations, window functions)
Best Practices
- Keep filters simple and understandable for everyone on your team
- When using nested groups, test them carefully to ensure they match the intended logic
- Filter early to reduce the amount of data that needs processing, improving performance
- If unsure, test filters in a preview mode with sample data
- For currency-based filters, use loose equality (≈) for flexible amount matching
Filtering
The filtering section lets you define which transactions should be included before any grouping, aggregation, or mapping takes place. It works exactly like conditions in a normal rule but applies at the very beginning of the DataFlow rule processing.
This step answers the question:
“Which transactions should be analyzed?”
You might only want to look at:
- transactions above a certain amount
- transactions in a specific country
- transactions from a specific channel
instead of all transactions.
Currency Handling: When filtering by amount, the system automatically parses currency symbols and formats. For example, filtering for amounts > 1000 will match "$1,200.50", "€1.000,00", and "1000 USD".
How Filtering Works
After loading the list of transactions using the Attribute path, the engine applies your filters to remove data you do not want. Only the items that match the conditions continue through the rule.
You can build filters in the same way as normal rule conditions, using:
- logical operators (AND / OR)
- nested conditions (groups)
- standard comparison operators (>, =, ≈, contains, etc.)
Filter Attributes
Here is a simple breakdown of the filter area:
| Field | Meaning | Example |
|---|---|---|
| Condition type | Determines if all conditions must be met (AND) or just one (OR) | “all” or “any” |
| Conditions | Individual checks on data fields | amount > 1000 |
| Group conditions | Combine conditions together, using AND/OR logic | (country = “CZ” OR country = “SK”) AND amount > 500 |
Order of execution in this block:
- Once the Attribute path has fetched all the transactions
- The filter conditions are applied
- Any item that fails the filter is excluded from further processing
- Only the filtered transactions move to mapping, grouping, aggregation, or window functions
Best Practices
- Keep filters simple and understandable for everyone on your team
- When using nested groups, test them carefully to ensure they match the intended logic
- Filter early to reduce the amount of data that needs processing, improving performance
- If unsure, test filters in a preview mode with sample data
- For currency-based filters, use loose equality (≈) for flexible amount matching
Visual in the rule engine UI
In the rule editor:
- You will see Filter Items
- You can add a new condition with "Add Filter Condition"
- You can group conditions with "Add Group Filter (AND/OR)"
- If no conditions are set, all transactions pass through

Quick Example
Imagine you only want to analyze transactions:
- above $1,000
- from the Czech Republic
- within the last 30 days
You would define three conditions:
amount > 1000country = "CZ"date >= 30 days ago
and combine them with an "all" (AND) logic.
Mapping
The mapping section allows you to transform or enrich your data before doing calculations. Think of it as “labeling” or “classifying” your transactions.
For example:
- renaming values
- changing codes to user-friendly labels
- categorizing transactions based on descriptions
- normalizing currency formats for consistent processing
This step makes the data easier to work with later in your aggregations or reports.
Currency Handling: Mapping can normalize currency values from different formats into consistent decimal numbers. For example, mapping "$1,234.56" to 1234.56 for mathematical operations.
How Mapping Works
After filtering, but before aggregations, you can apply mapping to any transaction field.
A mapping takes data from one field and creates a new field, or modifies an existing one.
For example:
-
mapping a transaction description to a category (“cash withdrawal” → “cash”)
-
mapping a payment type code to a readable label (type
001→ “transfer”)
Mapping Attributes
| Field | Meaning | Example |
|---|---|---|
| Source path | Where in the data the value comes from | $.description |
| Target field | The name you want to assign to the result | $.category |
| Mapping type | How the mapping should work (direct, regex, or conditional) | “regex” |
| Match operator | The way to match (equal, contains, etc.) | “contains” |
| Match value | What to look for in the source | “ATM” |
| Result value | What to assign if the match succeeds | “cash” |
Mapping Types
| Type | Description |
|---|---|
| Direct | Always copies the value directly |
| Regex | Uses a regular expression to match patterns |
| Condition | Uses conditions (equal to, contains, etc.) to transform values |
Order of execution in this block
- After filters remove unwanted transactions
- The engine applies all mapping definitions
- The mapped fields are then available for grouping, aggregations, or window functions
Best Practices
- Use clear, understandable names for your target fields
- Keep conditions in mapping simple to reduce errors
- When using patterns (regex), always test them carefully
- Document your mappings so other team members know what categories mean
- For currency mappings, consider using loose equality (≈) to handle various formats
Visual in the rule engine UI
In the rule editor, the mapping table will show:
- Source path
- Target field
- Type of mapping
- Matching logic
- Result value
You can add, edit, and remove mapping rows as needed.

Quick Example
Say you have transaction descriptions:
- "ATM withdrawal Prague"
- "ATM withdrawal Brno"
- "POS purchase supermarket"
You could define a regex mapping:
- match value:
ATM.* - result value:
cash
which transforms all ATM transactions to category "cash".
Aggregations
The aggregation section lets you summarize your data, which is the heart of DataFlow processing. You can count, sum, average, or find minimum and maximum values for a group of transactions.
This answers questions like:
- "How many transactions happened this month?"
- "What is the total amount per customer?"
- "What is the highest payment this year?"
Instead of showing data item by item, aggregations give you summary results.
Currency Handling: All aggregation functions automatically parse currency values before calculation. Sum, average, min, and max operations work seamlessly with mixed currency formats like "$1,000.00", "€1.234,56", and "1000 USD".
How Aggregation Works
After filtering and mapping, the data is grouped (if you defined a group) and then summarized using aggregation functions.
For each group, you can define multiple aggregation calculations.
Aggregation Attributes
| Field | Meaning | Example |
|---|---|---|
| Output path | Where to store the result | $.output.transaction_count['$.__group'] |
| Function | Type of aggregation to apply | count, sum, average, min, max, weighted average |
| Field path | Which field the function should summarize | $.amount |
| Weight field | If using weighted average, defines the weight field | $.weight |
| Window | Optional name of a rolling window to apply | “last 30 days” |
| Cutoff date | Optional date to stop calculations | “2025-12-31” |
Supported Functions
| Function | Description |
|---|---|
| count | Counts the number of items |
| sum | Sums up all values |
| average | Calculates the average |
| min | Finds the smallest value |
| max | Finds the largest value |
| median | Finds the middle value (or average of two middle values) |
| weighted average | Calculates an average weighted by another field |
Order of execution in this block
- Data is filtered
- Data is mapped
- Data is grouped
- Aggregations are applied per group
- The results are saved to the output path
If a window function is defined later, it will work on top of the aggregated results.
Best Practices
- Use meaningful output paths so your results are easy to find later
- Only aggregate what you need to keep the rule efficient
- Always group by a stable value (for example, month or customer ID) to avoid too many small groups
- Weighted averages should be tested carefully with your data
- Currency aggregations automatically handle international formats - no manual conversion needed
Visual in the rule engine UI
In the rule editor, you will see an aggregation table with columns for:
- Output path
- Function
- Field path
- Weight field (if needed)
- Window (optional)
- Cutoff date (optional)
You can add multiple aggregation rows and drag to reorder them if required.

Quick Example
Imagine you want to count how many transactions each customer made per month:
- Group by path:
$.month - Field path:
$.id - Function: count
- Output path:
$.output.transaction_count['$.__group']
The rule will then store a count of transactions for each month.
Window Functions
Window functions allow you to look at patterns over time inside each group of data. They calculate rolling values, previous values, or trends — which are critical for tracking balances, moving averages, or changes over time.
For example:
- "What was the balance after each transaction?"
- "What is the moving average over the past 30 days?"
- "What was the previous transaction amount for this customer?"
These functions give you richer, timeline-based insights.
Currency Handling: Window functions automatically parse currency values when performing calculations. Moving averages, rolling sums, and other operations work with mixed currency formats seamlessly.
How Window Functions Work
A window function works after grouping and ordering your data. It looks across multiple rows in sequence, for example:
- comparing a transaction to the previous one
- filling missing balances with the last known value
- calculating a rolling sum
The window is defined by:
-
which field to apply it to
-
what window of data to consider
-
what to output
Window Function Attributes
| Field | Meaning | Example |
|---|---|---|
| Output path | Where to store the window calculation result | $.output.moving_avg['$.__item.id'] |
| Field path | Which field to calculate on | $.amount |
| Function | Type of window function | last, lead, lag, forward_fill, moving average |
| Partition by path | Defines a subgroup within the data | $.customer_id |
| Order by path | Field to order the sequence | $.date |
| Window frame | Size of the rolling window | “30 days” |
Supported Functions
| Function (as shown in UI) | Description |
|---|---|
| Last | Shows the most recent available value for each point in time. |
| Forward fill | Fills any missing data with the last known value. |
| Lead | Retrieves the next value in the sequence (look ahead). |
| Lag | Retrieves the previous value in the sequence (look behind). |
| Moving average | Calculates a rolling average over a chosen window size. |
| Rolling sum | Calculates a running total over a rolling window. |
| Median | Finds the middle value within the window or partition. |
| Rolling median | Calculates a rolling median over a chosen window size. |
| Count | Counts how many items occurred up to each time point. |
| Min | Finds the smallest value observed in the window. |
| Max | Finds the largest value observed in the window. |
| Average | Calculates an ongoing average of all values seen so far. |
| Sum | Calculates a cumulative sum of values seen so far. |
Order of execution in this block
- After aggregations are done
- Data is ordered according to the Order by path
- Partitioning (if defined) splits the data into smaller series
- The window function is applied across each partition, one row at a time
Best Practices
- Always set an Order by path to ensure calculations are correct over time
- Use Partition by path when you want separate timelines (like separate balances for each customer)
- Keep window frames realistic to avoid performance issues (for example, 30 days instead of 365 days)
- Test on sample data to verify correct patterns
- Currency window calculations handle international formats automatically
Visual in the rule engine UI
In the editor, you will see a window function table with:
- Output path
- Field path
- Function
- Partition by path
- Order by path
- Window frame
You can add multiple window calculations for complex scenarios.

Quick Example
Say you want to show a rolling 30-day total of spending per customer:
- Field path:
$.amount - Function: rolling sum
- Partition by path:
$.customer_id - Order by path:
$.date - Window frame: 30 days
- Output path:
$.output.rolling_total['$.__item.id']
The rule then outputs the customer's running 30-day spending totals, after each transaction.
Function Blocks
Function blocks provide ready-made calculations that solve more advanced data analysis tasks inside your DataFlow rule. They are like mini “apps” you can add to a rule, without building all the logic from scratch.
Function blocks are ideal for more complex patterns, such as fraud detection or pairwise calculations.
How Function Blocks Work
A function block takes the filtered, mapped, grouped, and optionally aggregated data, then applies its specialized logic. You simply choose:
-
which function block to use
-
what parameters it needs
-
where to store the results
For example, a fraud detection function block might look for suspicious pairs of transactions in the data you just grouped.
Function Block Attributes
| Field | Meaning | Example |
|---|---|---|
| Function | The name of the function block to run | fraud_pairs |
| Output path | Where to store the result | $.output.suspicious_pairs |
| Parameters | Inputs to guide the block’s logic | minimum amount, time window, etc. |
Each function block defines its own list of parameters. You only need to fill these in when adding the block.
Available Function Blocks
Here are some examples included in the platform, with more to be added later:
Function Blocks
Function blocks provide ready-made calculations that solve more advanced data analysis tasks inside your DataFlow rule. They are like mini “apps” you can add to a rule, without building all the logic from scratch.
Function blocks are ideal for more complex patterns, such as fraud detection or pairwise calculations.
How Function Blocks Work
A function block takes the filtered, mapped, grouped, and optionally aggregated data, then applies its specialized logic. You simply choose:
- which function block to use
- what parameters it needs
- where to store the results
For example, a fraud detection function block might look for suspicious pairs of transactions in the data you just grouped.
Function Block Attributes
| Field | Meaning | Example |
|---|---|---|
| Function | The name of the function block to run | fraud_pairs |
| Output path | Where to store the result | $.output.suspicious_pairs |
| Parameters | Inputs to guide the block’s logic | minimum amount, time window, etc. |
Each function block defines its own list of parameters. You only need to fill these in when adding the block.
Available Function Blocks
Here are some examples included in the platform, with more to be added later:
| Function Block | Description |
|---|---|
| Fraud Pairs | Finds pairs of transactions that look suspicious based on timing or amounts |
| Pairwise Division Sum | Sums the results of dividing one transaction amount by another |
| Pairwise Product Sum | Sums the results of multiplying pairs of transaction amounts |
Pairwise Division Sum — Edge Case Handling
The Pairwise Division Sum function block divides each element of a numerator array by the corresponding element of a denominator array, and sums the results. It is commonly used for calculations such as weighted averages — for example, dividing monthly inflow sums by monthly end-of-month balances and summing the ratios.
Key-based alignment for associative arrays
In real-world data, it is common for the two input arrays to cover different date ranges. For example, a balance_monthly_end aggregation might produce values starting from 2020-01, while an inflow_monthly_sum starts from 2020-12 — resulting in arrays of different lengths (e.g. 75 vs 64 elements).
When both input arrays are associative (keyed by date or another identifier), the engine automatically aligns them by their common keys before performing the calculation. This works like an inner join:
- Only keys present in both arrays are paired together
- Keys that exist in only one array are skipped
- The order of keys does not matter — matching is done by key name
Example:
Numerator (inflow sums):
{
  "2021-01": 500,
  "2021-02": 600,
  "2021-03": 700,
  "2021-04": 800,
  "2021-05": 900
}
Denominator (end-of-month balances):
{
  "2021-03": 10000,
  "2021-04": 12000,
  "2021-05": 11000
}
The engine finds 3 common keys (2021-03, 2021-04, 2021-05) and computes:
$$\frac{700}{10000} + \frac{800}{12000} + \frac{900}{11000} = 0.07 + 0.0\overline{6} + 0.08\overline{18} \approx 0.2185$$
Division by zero
If a denominator value is zero for any paired element, that pair is skipped rather than causing an error. The sum continues with the remaining pairs.
Indexed (non-keyed) arrays
When both arrays are simple indexed arrays (no keys), they are matched by position and must have the same length. A length mismatch produces an error with a diagnostic message showing the actual sizes.
Mixed inputs
When one array is associative and the other is indexed, keys are stripped from the associative array and the arrays are matched by position. Same-length requirement applies.
Overlap metadata
When key-based alignment is used, the result includes additional fields that show how much data was actually matched:
| Field | Meaning | Example |
|---|---|---|
matched_keys_count | Number of keys that were found in both arrays and used in the calculation | 64 |
total_keys_numerator | Total number of keys in the numerator array | 75 |
total_keys_denominator | Total number of keys in the denominator array | 64 |
This makes it transparent how much of the data contributed to the result. For example, if matched_keys_count is 3 but total_keys_numerator is 75, you know only a small fraction of the numerator data was used.
These fields are only present when both inputs are associative arrays. For indexed arrays, all elements are always used (since lengths must match).
Zero overlap
If two associative arrays share no common keys at all, the function returns an error instead of silently returning zero:
No common keys between numerator (X keys) and denominator (Y keys)
Error diagnostics
The function provides clear error messages when inputs are invalid:
| Scenario | Error message |
|---|---|
| Missing paths | Missing set paths |
| Null input | numerator '<path>' resolved to null |
| Non-array input | numerator '<path>' resolved to <type>, expected array |
| Upstream error propagation | numerator '<path>' contains an upstream error: <message> |
| Length mismatch (indexed) | Length mismatch: numerator has X elements, denominator has Y elements |
| No common keys (associative) | No common keys between numerator (X keys) and denominator (Y keys) |
Note: The Pairwise Product Sum function block follows the same edge case handling rules — key-based alignment, overlap metadata, zero-overlap error, and error diagnostics work identically.