Quick guide
- Click “+ Function” to create a new function.
- Give the function a Title and an Identifier. Use only lowercase letters and numbers for the Identifier.
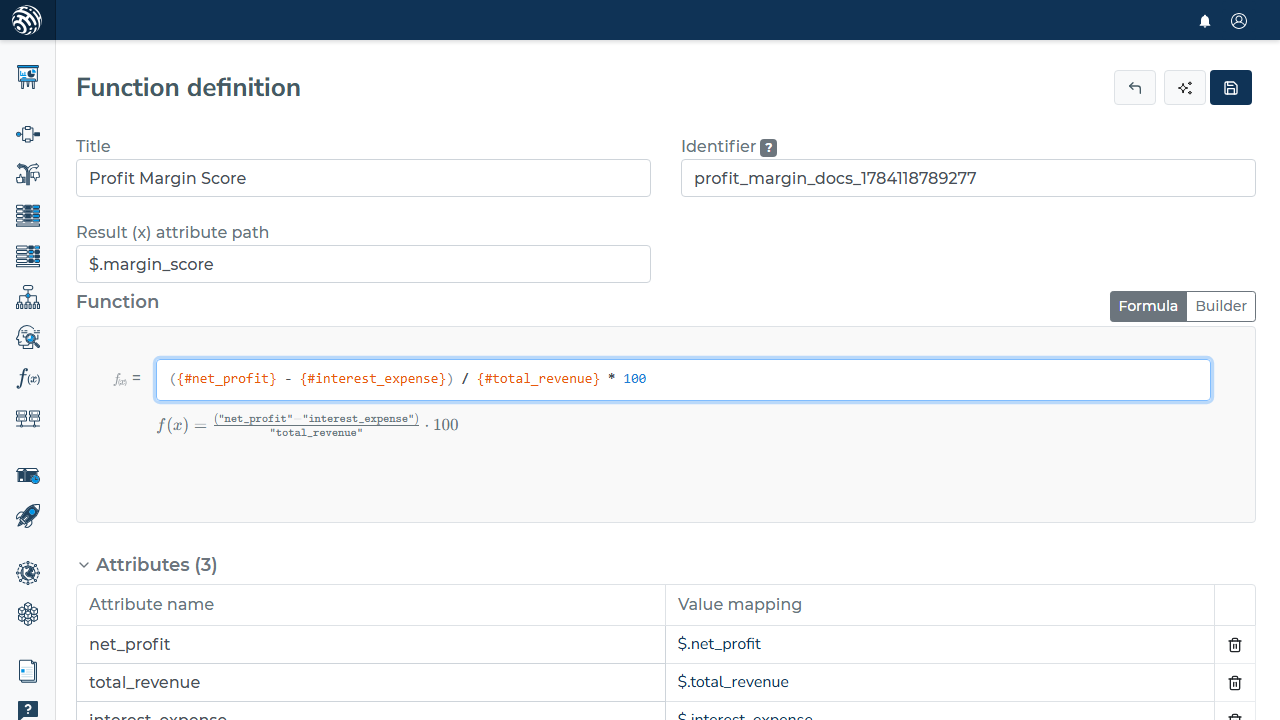
- Write down a result attribute path — the output of the function will be stored there (for example
$.margin_score). - Type the formula in the editor next to
f(x) =, the way you would write it on paper. Reference input data by typing its path:$.net_profitfollowed by a space becomes the variable{#net_profit}automatically. - Press Save or the CTRL+S key shortcut.
Function definition
Give your function a title and identifier so that you can find it. The TITLE is for the rule management portal only, IDENTIFIER will get propagated into decision steps.
The most important part is the RESULT (X) ATTRIBUTE PATH. That is JSONPath to the attribute in the data object which will contain the result of the evaluation of your function.
Writing the formula
Formulas are plain text — no clicking through menus. The editor colors the parts of the formula as you type, marks problems with a wavy underline, and renders a live mathematical preview below the input whenever the formula is valid.

-
Variables are written as
{#name}. Each variable maps to an attribute of the incoming data object (see Attributes below). -
Create variables by typing the data path. Type
$.net_profitand press space — the attribute is created for you and the path turns into{#net_profit}in place. -
Autocomplete. As you type, the editor suggests your variables, function names, and constants. Move through the list with the arrow keys and insert with Enter or Tab.

-
Quick fix for unknown variables. If you reference
{#something}that does not exist yet, the editor shows the problem and offers a one-click “Create attribute” button.
What you can use in a formula
- Numbers, parentheses, and the operators
+,-,*,/,%(modulo), and^(power). - Mathematical functions:
sin,sinh,arcsin,arcsinh,cos,cosh,arccos,arccosh,tan,tanh,arctan,arctanh,sqrt,abs,ln,log10,min,max,round,floor,ceil,pow(roundandpowtake at most two arguments). - Date functions:
date_to_timestamp,year. - Constants:
e,pi, andrand(a random number).
Attributes
Every {#variable} maps to a JSONPath in the incoming data object. The mapping lives in the collapsed Attributes section below the formula. The editor fills it in as you type data paths; expand the section to rename variables, adjust paths, or remove ones you no longer need.

Builder mode
Typing the formula is the recommended way to work. The visual block editor from earlier versions is still available — switch from “Formula” to “Builder” in the top-right corner of the function box. Both modes edit the same definition, so you can switch back and forth freely. See Function builder mode for details.
Testing a function
Let's create a function to calculate the financial health indicator, which is used to assess an SME’s overall financial health. We'll make use of the data object's mapping: $.net_profit, $.total_revenue, $.total_debt, $.interest_expense, $.ebit. The outcome will be saved in the attribute $.financial_health_indicator of the resulting data object.
Then you can test the function in three ways:
-
Unit test: When testing, the portal shows which values to provide. After hitting the “Run test”, you can see what the result will be.
-
Object test: When doing object test, you need to select a data object and then run a test.
-
Batch test: when you want to try many combinations of values at once, use the Batch test tab. It works like a small spreadsheet.
Batch testing
The Batch test tab shows a grid with one column per function variable and one row per test record.
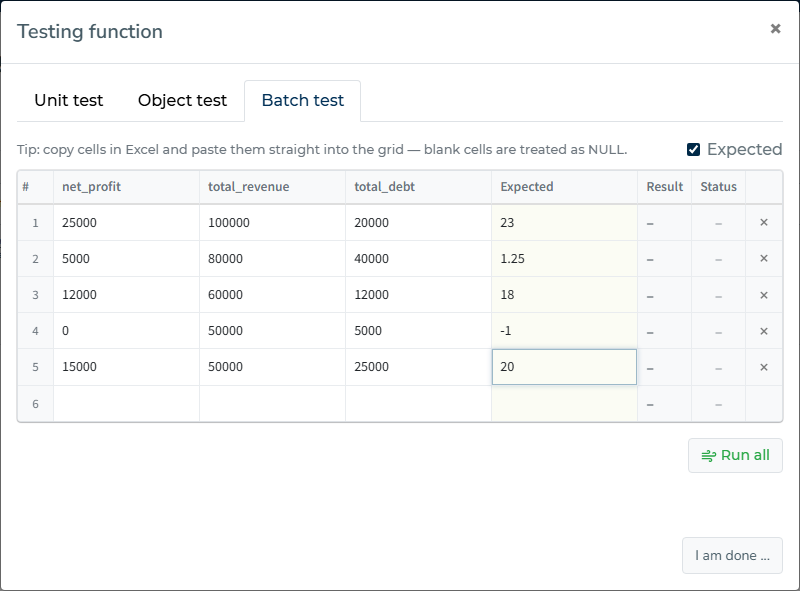
- Paste from Excel: copy a range of cells in Excel (or Google Sheets) and paste it straight into the grid with CTRL+V. You can paste right after opening the tab — the grid fills from the first cell — or click into a specific cell to paste starting from there.
- Type it in: an empty row always waits at the bottom of the grid; typing into it adds another one, so there is no “add row” button to click. Move around with the arrow keys; Enter jumps to the row below, just like in a spreadsheet.
- Blank means NULL: leave a cell empty and that variable is sent as NULL, the same as the NULL toggle in the unit test.
- Numbers only: function inputs are numeric, so the grid only accepts numbers (scientific notation such as 1.2e-5 works too). Decimal commas from European Excel locales are converted automatically — 10,5 becomes 10.5.
- Expected values: tick the “Expected” checkbox to add an expected-result column. After the run, every row shows PASS or FAIL, so you can validate a whole scenario sheet in one click.
- Run all: hit “Run all” and each row is evaluated, showing its status and result as responses arrive. Click a row’s result to unfold the full evaluation detail.
- Export: download all inputs and results as a CSV file that opens directly in Excel.
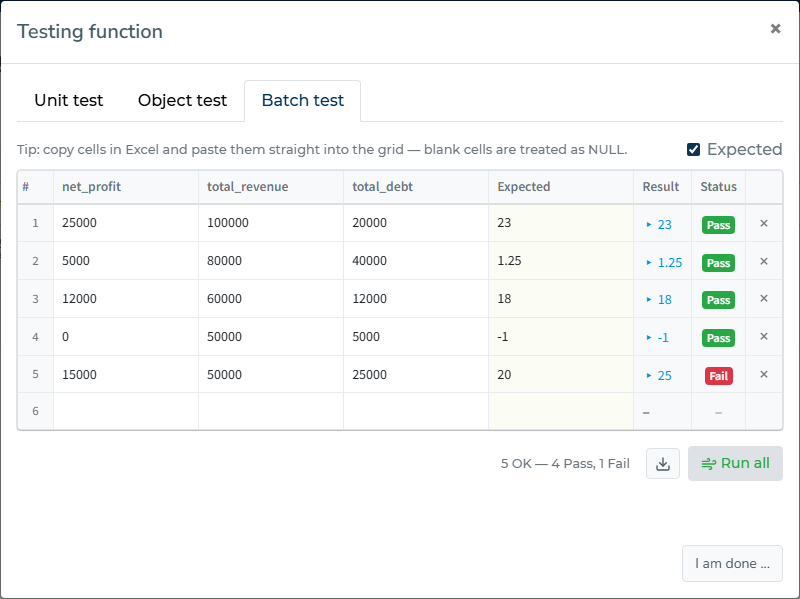
Blank rows are skipped when running and exporting, so the lingering empty row never pollutes your results.
Explain
There is an “Explain” feature for each function. It uses GPT-4 model for explaining the function in human terms.
You can see the explanation details of a certain function by clicking “Explain” from the drop-down menu of “Settings” button icon when viewing a function.

Working with dates
Working with dates involves converting dates into a format that allows for easy manipulation and comparison. The function date_to_timestamp is designed to convert a given date into its equivalent number of seconds since the Unix epoch (January 1, 1970, 00:00:00 UTC). This conversion is useful for calculating the difference between two dates.
To find the difference between two dates, convert both dates to their timestamp representation using date_to_timestamp and subtract one from the other. The result will be the difference in seconds. To convert this difference into more manageable units like days, hours, months, or years, perform the following divisions:
- Days: Divide the difference by 86,400 (the number of seconds in a day).
- Hours: Divide the difference by 3,600 (the number of seconds in an hour).
- Months: For a rough estimate, divide by 2,592,000 (the average number of seconds in a month, considering a 30-day month).
- Years: For a rough estimate, divide by 31,536,000 (the number of seconds in a year, assuming a 365-day year).
When a date cannot be used
A date the calculation cannot use does not stop the decision flow. The step stores 0 as its result, records what went wrong in __math_error under the step's output, and the flow carries on to the next step.
All of these are treated the same way:
- the attribute is absent from the incoming data object
- it holds an empty value, or only spaces
- it holds text that is not a date, such as "N/A"
- it holds a zero date such as
0000-00-00 - it arrives as a list rather than a single value
So an age built on an unusable date comes out as 0 rather than as a plausible looking number. Since 0 cannot be told apart from a genuine result of 0, check __math_error, or test the date attribute in a rule set, wherever the result drives eligibility such as a minimum age check.
Calculating an age
For a whole number of completed years, subtract the earlier date from the later one, divide by 365.25 * 24 * 60 * 60, and wrap the result in floor:
floor((date_to_timestamp({#date_application}) - date_to_timestamp({#date_birth})) / (365.25 * 24 * 60 * 60))
floor is what makes it an age. Without it, someone aged 17 years and 11 months is reported as 17.98, and a threshold written against 18 can go the wrong way. The 365.25 accounts for leap years. Subtracting in the opposite order produces a negative age, and every threshold compared against it then gives the opposite answer.
year returns only the calendar year, so year(application) - year(birth) is not an age. It is wrong by up to a full year for anyone whose birthday has not yet passed.
Revisions
Revision history can tell you what a function looked in the historical version. You can view what was the definition, and who made the changes.
You can see the revision history of a function by clicking “Revisions” from the drop-down menu of “Settings” button icon when viewing a function.
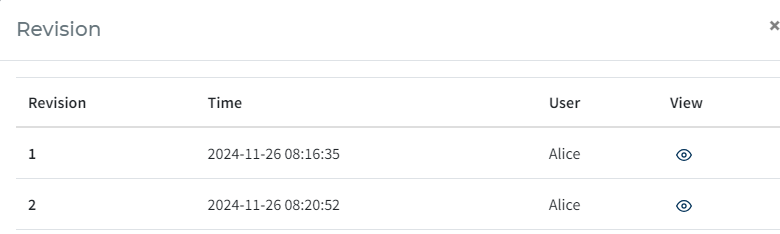
A new modal window will appear after you clicked “Revisions”, with a list of all historical changes and who made them. By clicking the eye icon, you can see the definition of the function at that time.