Why product attributes make your scorecard look strong and should not be in it
The scorecard passed validation. Look at what it learned.
You have built or bought a scorecard on your own approved book. Its validation AUC looks convincing, and the modelling work appears complete. Still, before you trust the top characteristics, split them into two groups: facts about the borrower, and facts about the loan your organisation chose to sell.
The difference is stark. It appears in the public US Small Business Administration seven-a loan approval file used here: across the full pool of 112,000 sampled loans, borrower characteristics moved charge-off rates by roughly a factor of two. Sector ranged from 2.29% to 5.14%; supported jobs, from 2.15% to 4.19%.
The loan characteristics moved the same outcome by a factor of twenty four. Loans running for 42 months or less had a full-pool charge-off rate of 14.94%, while loans running for more than 120 months had a rate of 0.62%. The longest band contained 1,270 loans and had no charge-offs.
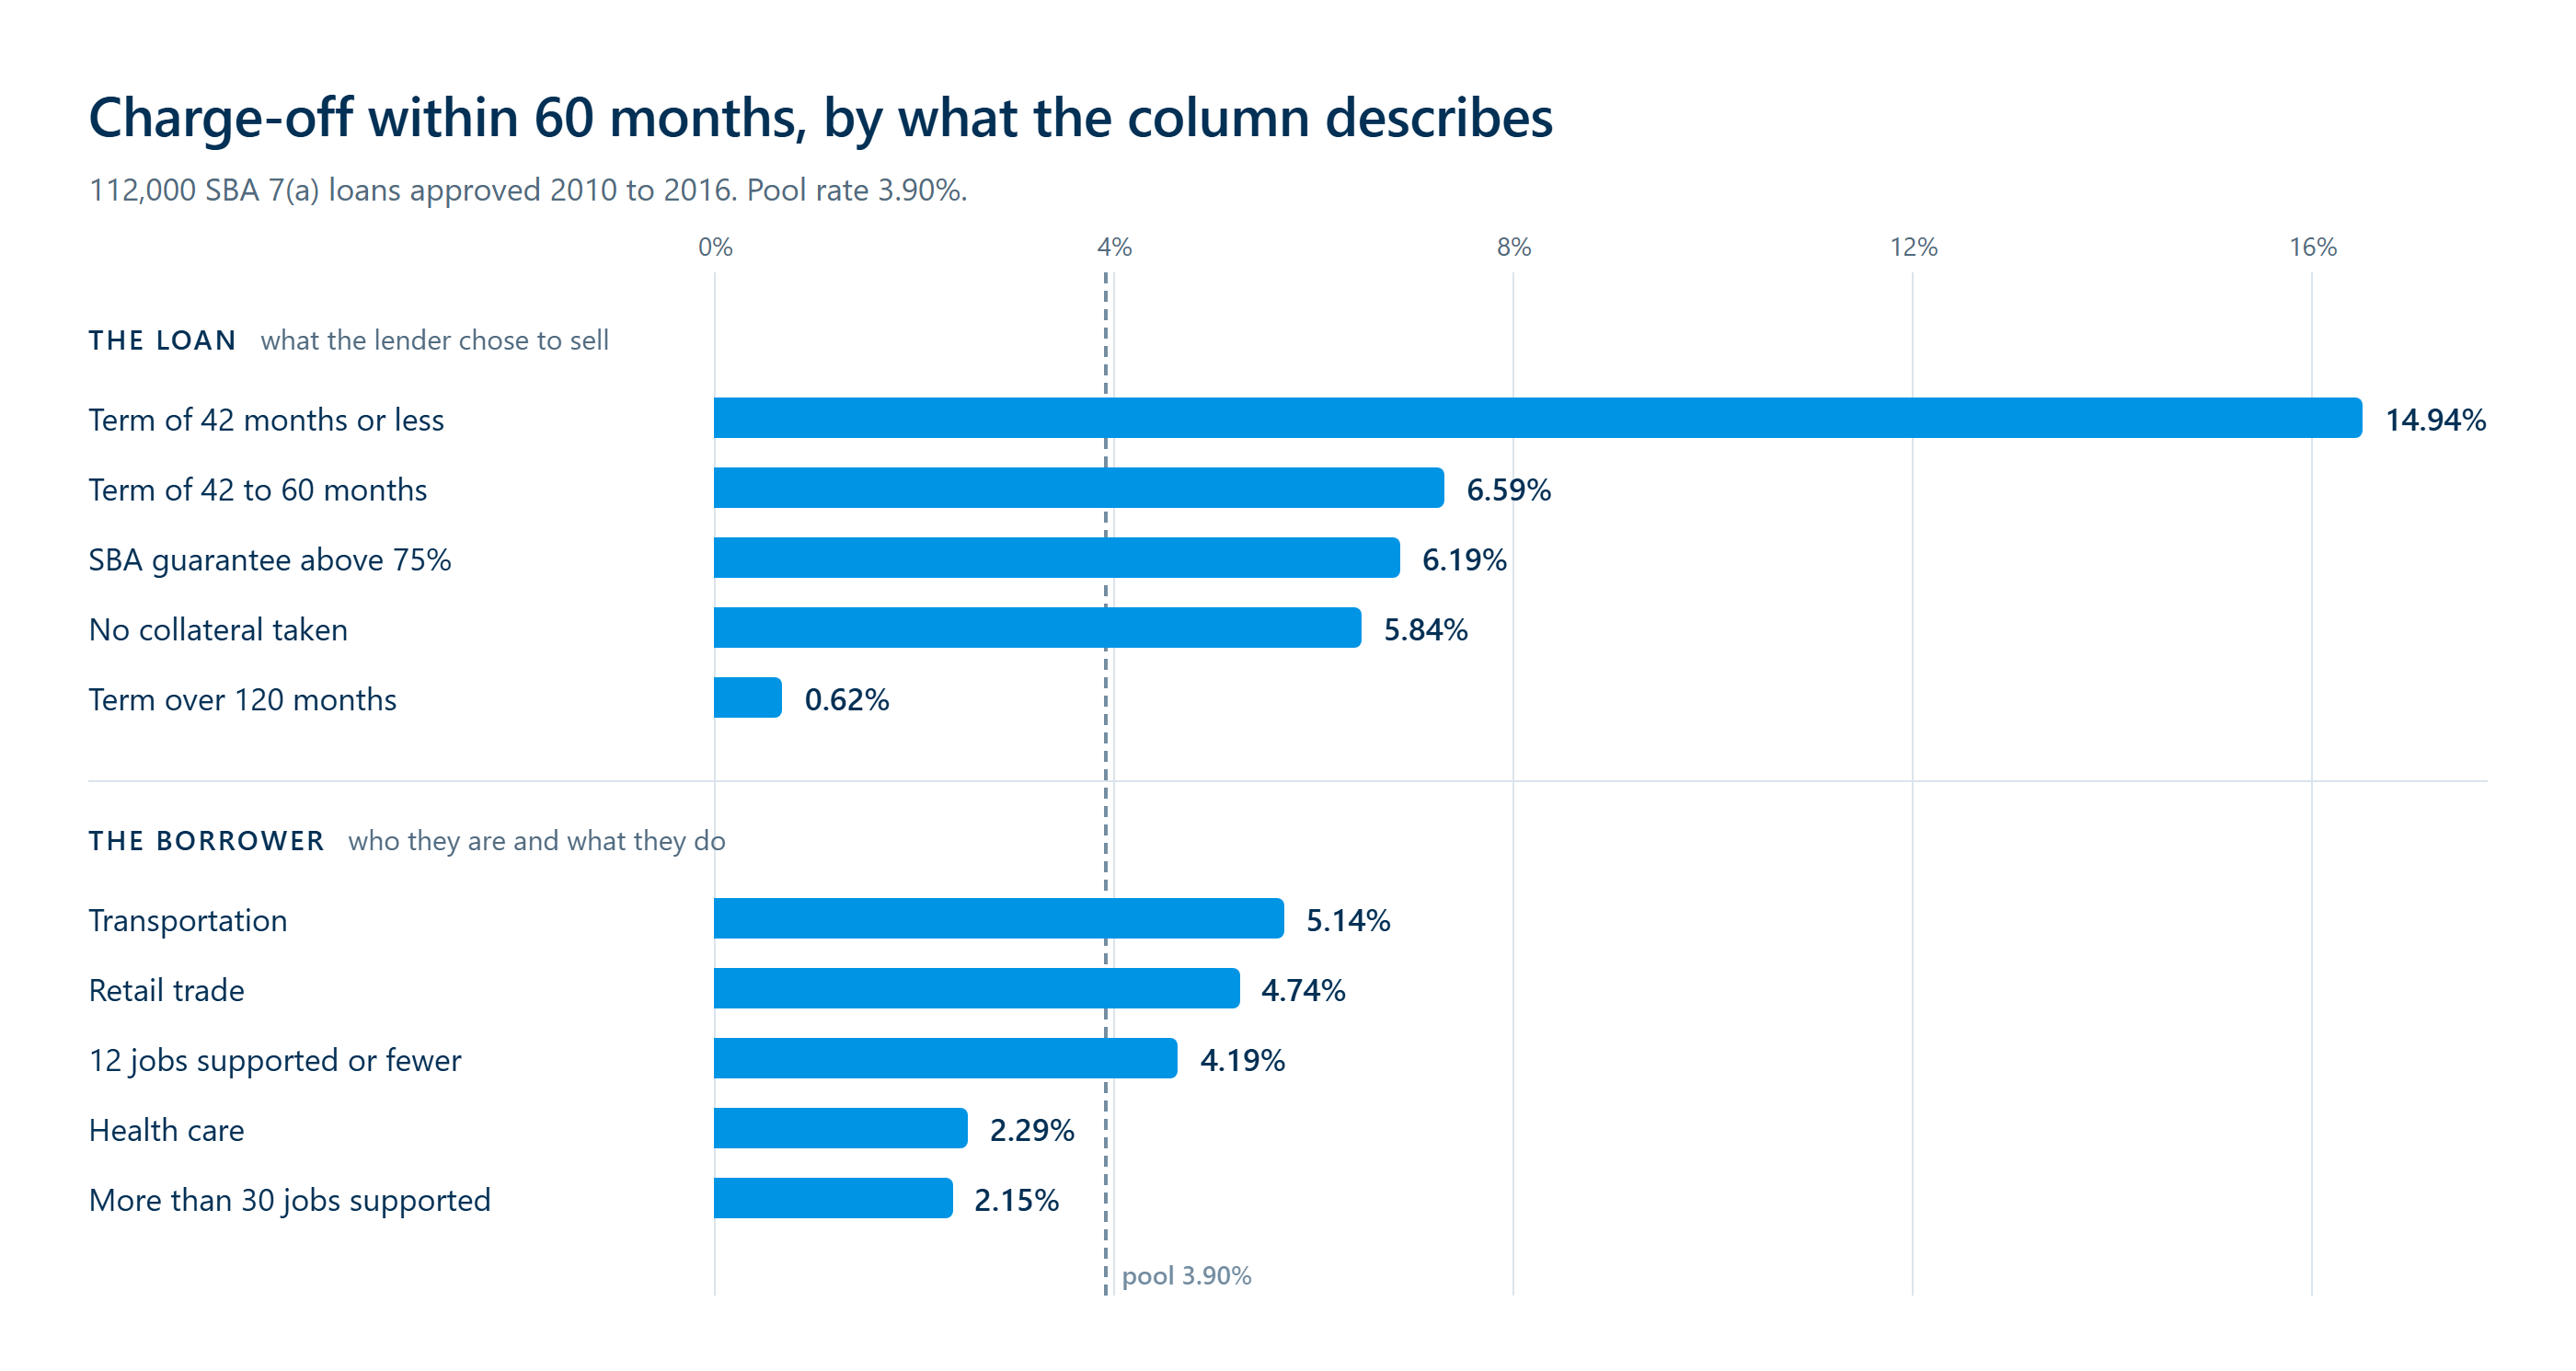
That is the first warning. The borrower is not the same thing as the loan. Term, guarantee share, collateral, approval amount, programme and interest rate describe what the lender chose to sell, at what price and under which programme. They are not clean facts about the borrower. The guarantee share needs a careful translation: in this file, it is a parameter of a US government loan programme, not a commercial lender’s own pricing decision. In your book, the equivalent columns are the term, collateral, approval amount, programme and interest rate set through your own pricing and product design. The lender sets the interest rate partly for risk. That makes it the most circular column in this file.
The first run measured the lender’s choices
The data came from the public SBA seven-a approvals file. It covered approvals between 2010 and 2016. Cancelled loans were dropped, along with a further 200 rows missing first-disbursement dates, missing terms or zero approval amounts. The usable loans were then sampled at 4,000 approvals per quarter, so every vintage carried the same weight. Split by time, the pool produced 78,400 training rows and 33,600 validation rows.
The outcome was charged off within 60 months of first disbursement. Across the pool, the charge-off rate was 3.90%. Training recorded 3.79%, and validation recorded 4.16%.
The first run produced a scorecard AUC of 0.8443 in training and 0.8608 out of sample. Its dominant characteristic was a quantity invented from the interest rate, the guarantee percentage and the term in months. It had no meaningful unit. The quantity combined three decisions made by the lender and presented the result as risk.
The strongest finding was a threshold on that quantity. In training, 28,560 loans above the threshold charged off at 9.50%, against 3.79% for the book. Its training information value was 1.708; its out-of-sample lift was 3.20. The top nine findings had the same shape: ratios built from the loan’s own terms. None named the borrower.
The model was not badly fitted. It was fitted correctly, but on a target it should not have been given. The reason was the loan design. It genuinely predicted the outcome because that design reflected decisions already made by the lender.
Excluding product terms did not solve the problem
The first attempted restriction was simple: each derived quantity had to include at least one borrower characteristic. It did not stop the ratios. The next run still built them from the guarantee percentage, jobs supported, approval amount and term. Validation AUC rose to 0.8524. Its top finding still had 3.13 lift out of sample.
A borrower characteristic had been added. It changed nothing: the same loan terms still drove the result and remained at the centre of the finding.
A further run reduced the laundering. The validation AUC fell to 0.6405 and its top finding lift to 1.78. Still, three of its eight derived quantities carried a product term as part of the calculation. The product decision had not disappeared. It had changed disguise.
The corrected run looked worse because it was more honest
The corrected run used two rules. First, a derived quantity had to separate the outcome better than the product-only structure inside it. A product term could appear as the instalment in an affordability ratio or as a divisor. It could not be added as a free-standing summand.
This distinction matters. An instalment divided by income represents a relationship a credit policy may actually test. A rate, guarantee share and term combined into an invented ratio merely mixes the lender’s own choices.
On the same pool and the same outcome, the corrected run produced a training AUC of 0.6407 and an out-of-sample AUC of 0.6277. Its top finding had 1.19 lift out of sample. The scorecard retained six characteristics: two derived quantities, sector, legal form, census division and franchise status.
Both surviving derived quantities still contained product terms: one used jobs supported, term, guarantee percentage and amount, and the other used jobs supported, term, amount and interest rate. The loan stayed in the model. What the correction removed was the product mix pretending to be borrower risk on its own.
The corrected rule remains working-tree code, not a released change. It is under test against the public file. The test ran four tests and 168 assertions, all green, in 1 minute 48 seconds, checking for the absence of product or channel conditions in findings and the exclusion of quantities built from product terms alone.
The signal is real. Put it where a committee can see it.
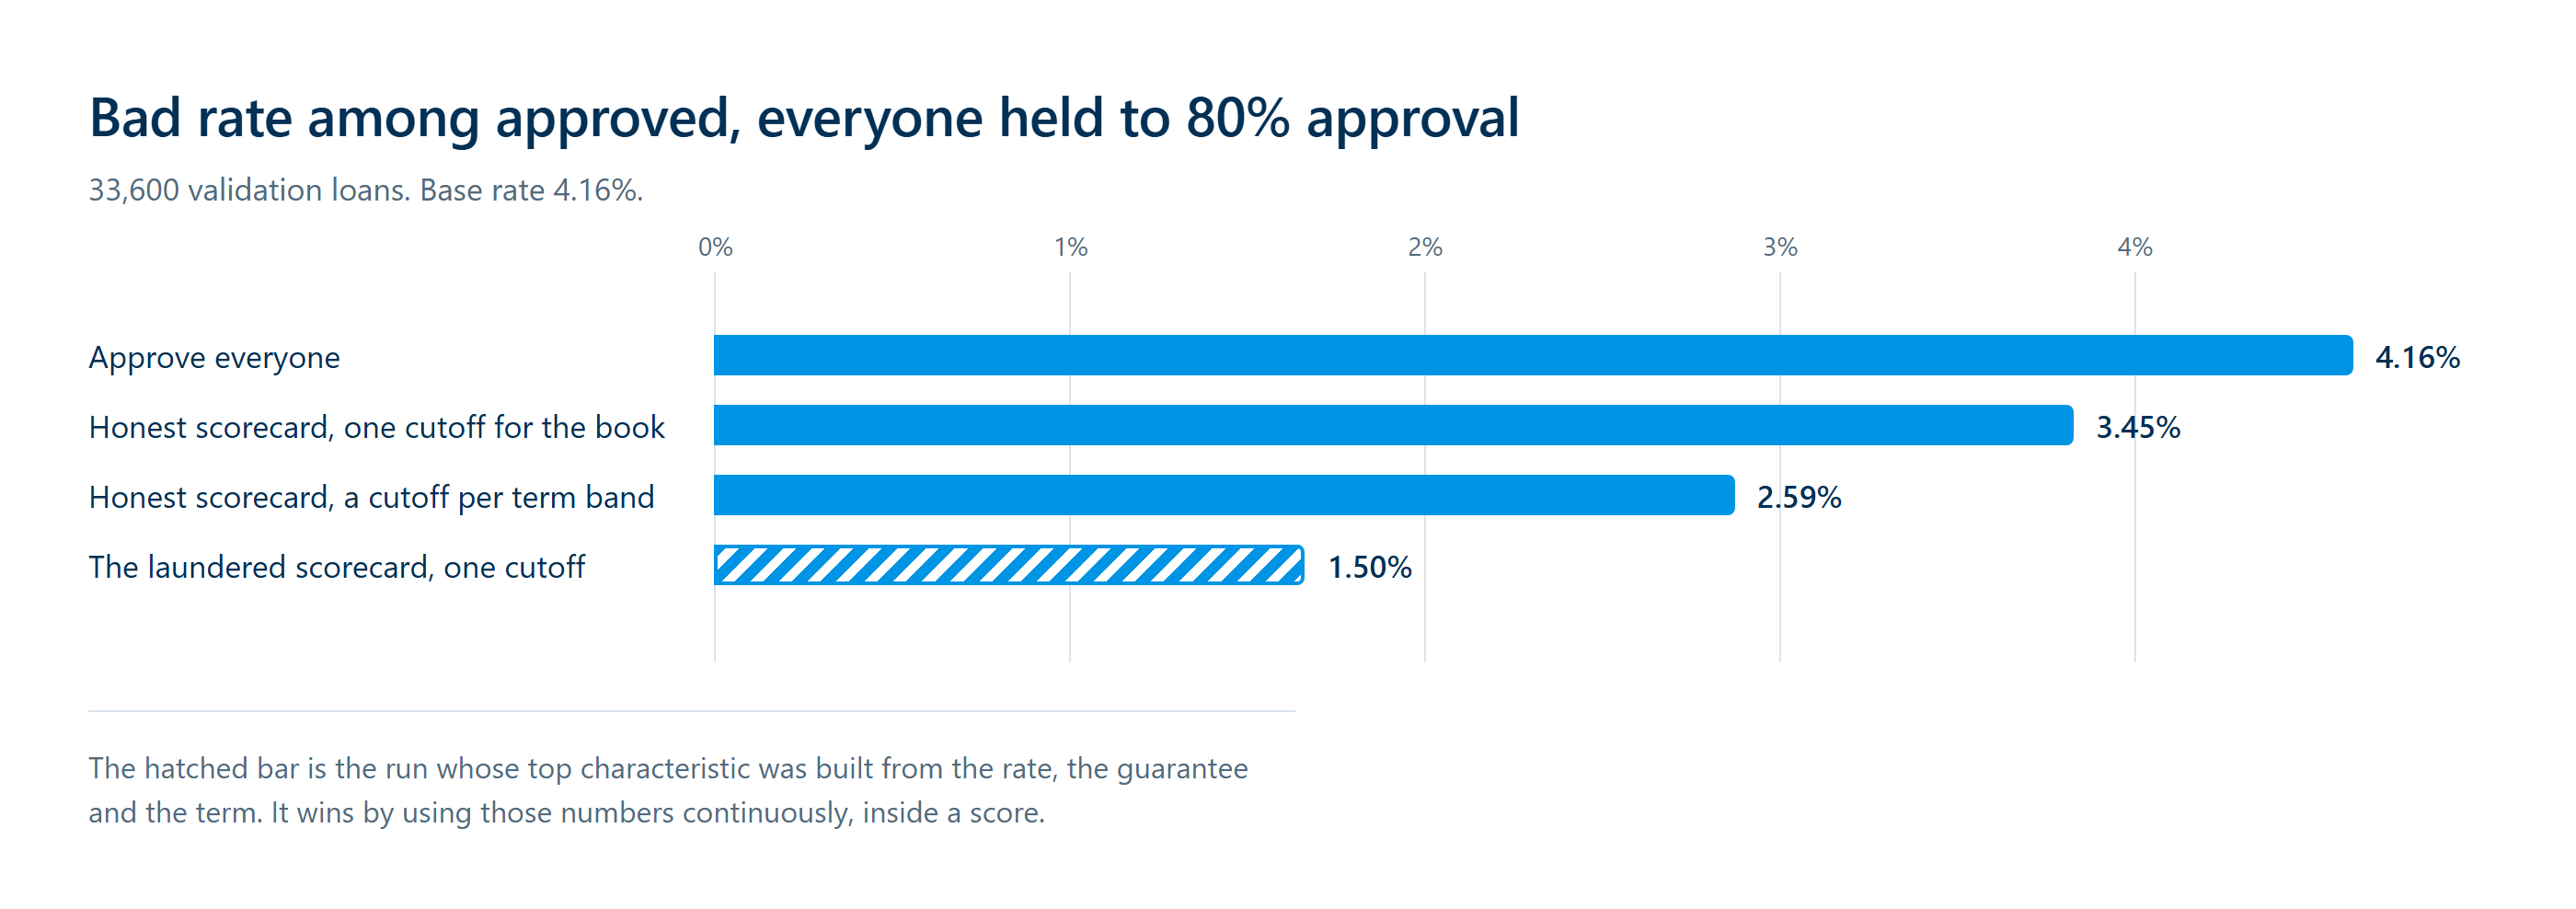
On the validation rows, where every comparison held the approval rate at 80%, the honest scorecard still found useful separation. Approving everyone produced a 4.16% bad rate. One cutoff for the honest scorecard produced 3.45%. Giving the honest scorecard its own cutoff in each term band produced 2.59%.
The laundered scorecard produced 1.50% with one cutoff. The result was stronger. Its strength came from using the product numbers continuously and hiding the product grid inside a score.
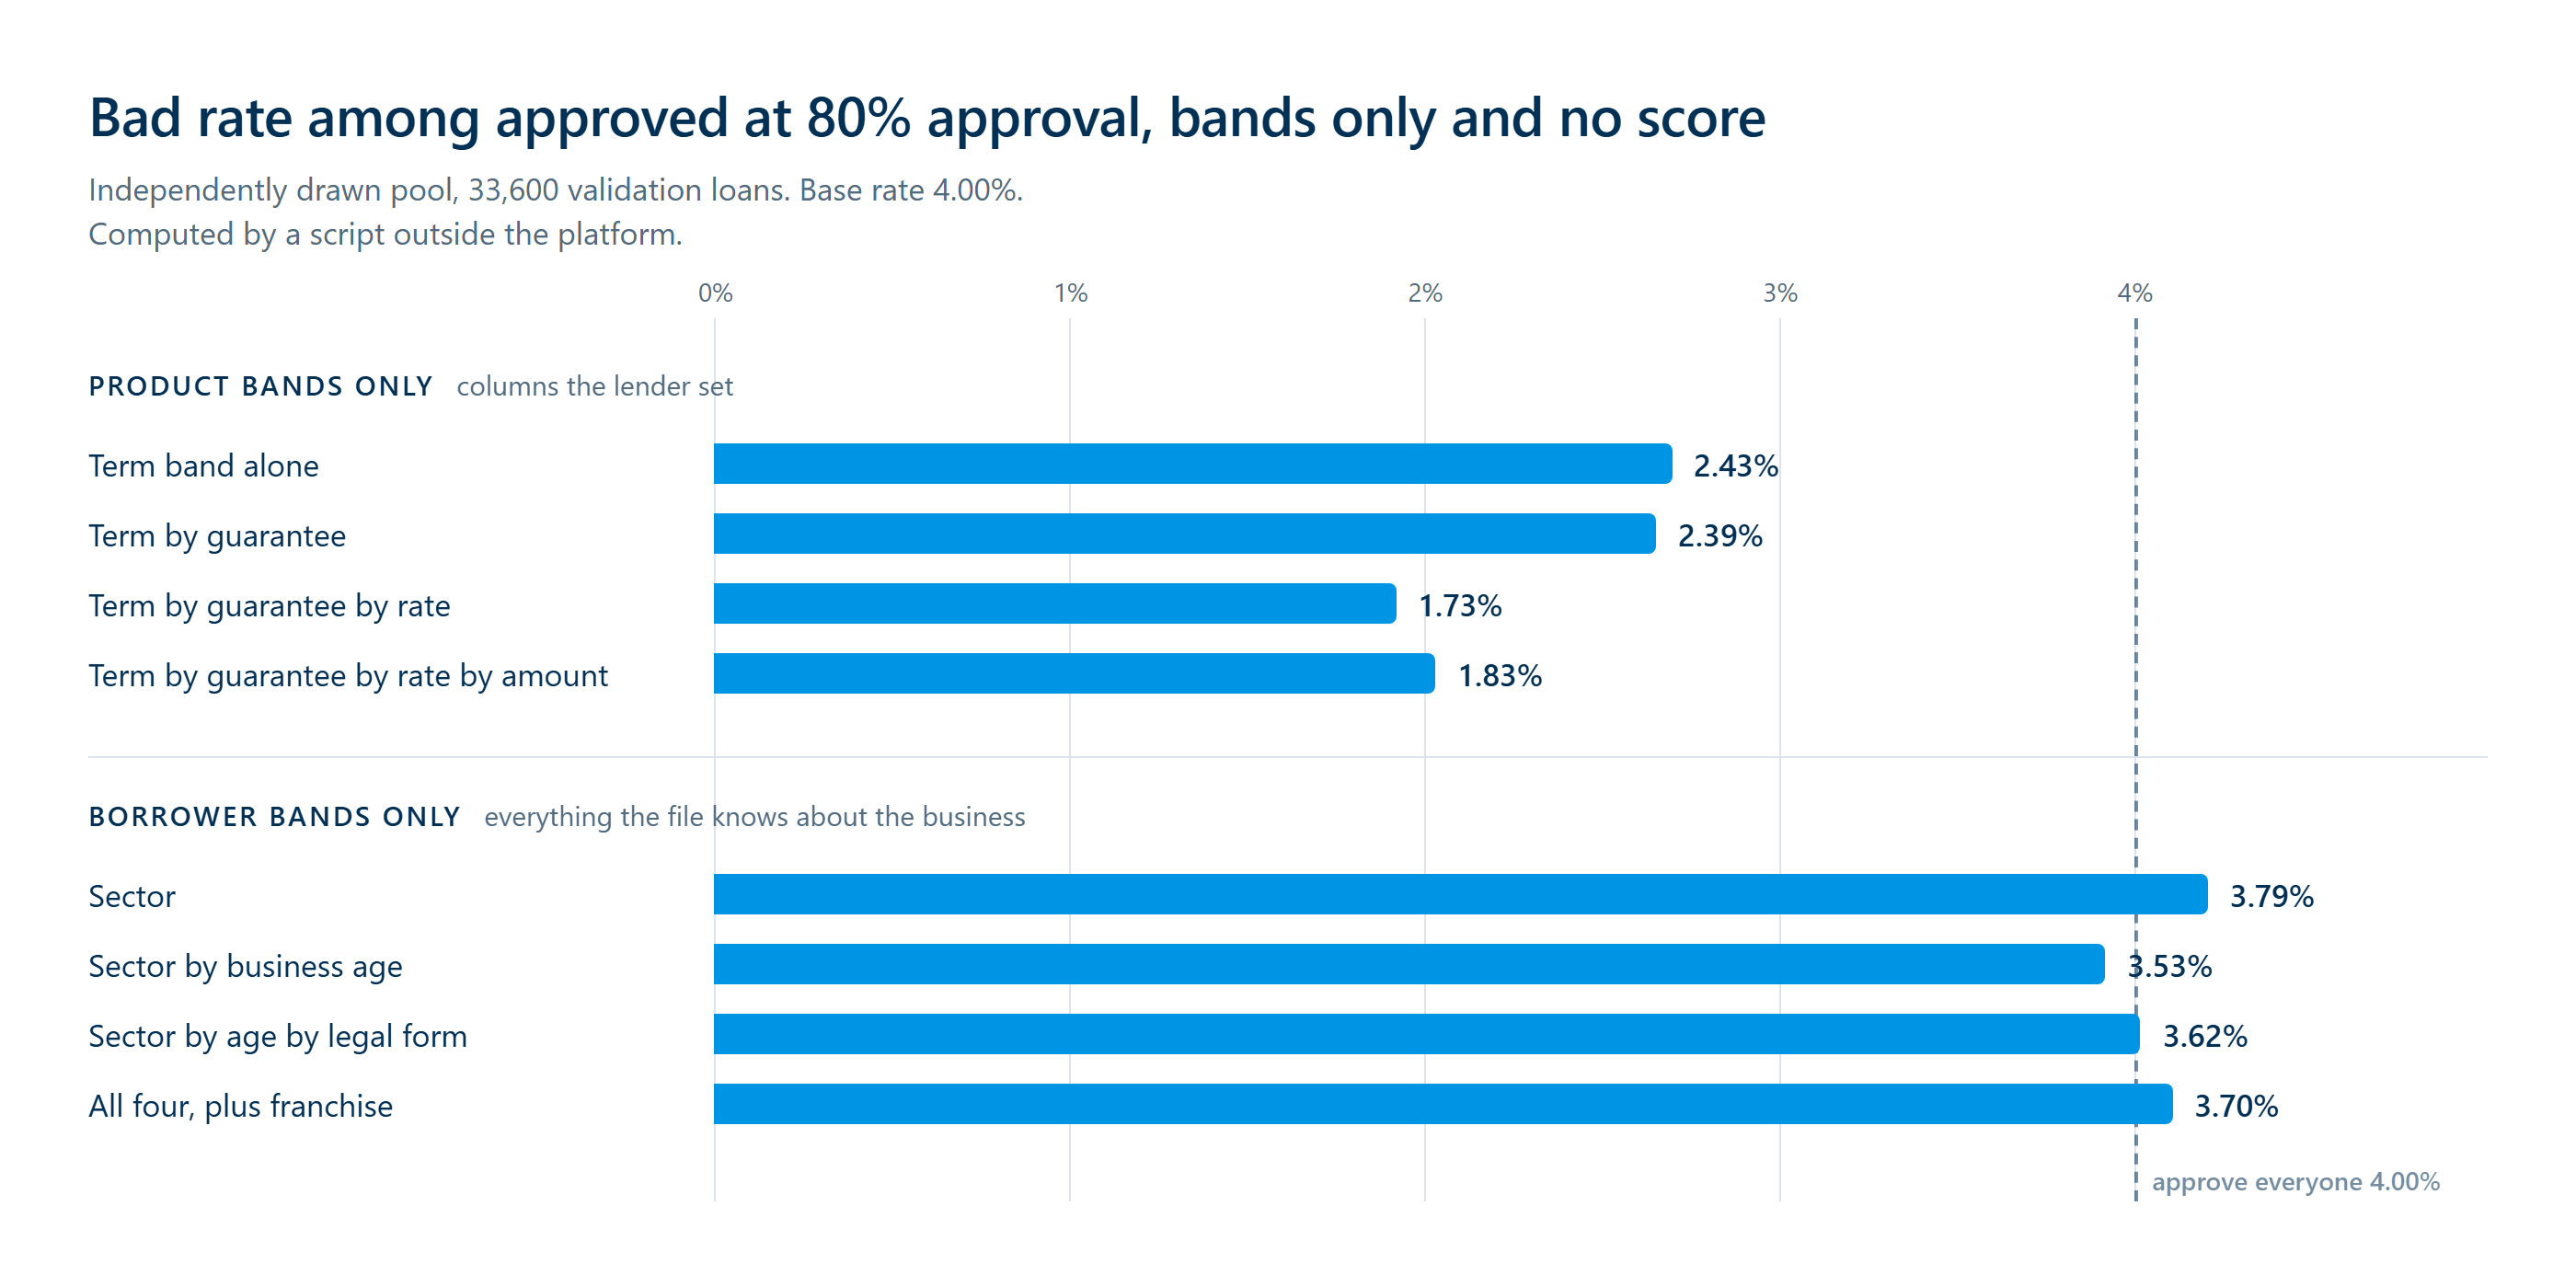
The distinction emerged from a separate hand-built analysis of an independently drawn pool. A script outside the platform calculated it. Ranked by training charge-off rate, term bands produced a 2.43% validation bad rate among approved loans. Combining term, guarantee and rate produced 1.73%; adding amount made the result worse, at 1.83%, as the grid ran out of loans per cell.
The borrower-only versions were weaker. Sector alone produced a 3.79% bad rate among approved loans. Add business age, legal form, supported jobs and franchise status, and the results range from 3.53% to 3.70%. The independently drawn pool had a 4.00% validation base rate.
The signal is worth keeping. Where it belongs is the question. Inside the score, it can pass as a fact about the borrower. Move it into the cutoff instead: there, it becomes a product decision that a credit committee can see, price and overrule.
The test to run on your scorecard
Take the top five characteristics in your scorecard. For each one, ask who sets it.
- Does your pricing team set it?
- Does your product team choose it?
- Does underwriting determine it as part of the offer?
- Look past the label. Is this a borrower characteristic, or a consequence of the loan you sold?
The precise rates will move with the sample. Independent draws of the same design moved the pool rate from 3.71% to 3.83%, and the smallest segments moved more. The direction held. In this public book, loan terms carried much more separation than the borrower characteristics.
Your scorecard’s best characteristic may be a decision your own organisation made. The honest response is not to delete a real signal. Identify it. Then move it out of the borrower score and place it in a cutoff or product policy, where its meaning is visible.
Frequently asked questions
Why should product attributes not stand alone in a credit scorecard?
Product attributes should not stand alone as borrower-risk characteristics because they describe the loan the lender chose to offer, not a clean fact about the borrower. Loan design can predict charge-off because it reflects decisions the lender already made. Keep that signal in a cutoff or product policy, where its meaning is visible.
Why can a scorecard’s strongest feature be misleading?
A scorecard’s strongest feature can be misleading when it combines loan terms chosen by the lender and presents them as borrower risk. In the SBA analysis, a quantity built from interest rate, guarantee percentage and term dominated the first scorecard, despite having no meaningful unit. It predicted charge-off, but measured the lender’s own design choices.
Should lenders remove every product term from a scorecard?
No. A product term can appear in a derived measure that represents a credit relationship, such as an instalment-to-income affordability ratio, or as a divisor. It should not be added as a free-standing term that lets product structure alone drive a finding.
How can lenders use loan terms in credit decisions?
Lenders can use loan terms to set a separate cutoff for each term band, rather than let those terms masquerade as borrower risk inside the score. In the SBA validation comparison, term-band cutoffs lowered the bad rate among approved loans compared with one cutoff at the same approval rate. This keeps the product decision visible to the credit committee.
How do I identify product attributes in a scorecard?
A scorecard characteristic is a product attribute when the pricing, product or underwriting team sets it as part of the loan offer. Ask whether it describes the borrower or follows from the loan your organisation chose to sell. Term, collateral, approval amount, programme and interest rate are examples.